

Question: Discussion Question The table below shows monthly data collected on production costs and on the number of units produced over a twelve month period. Month
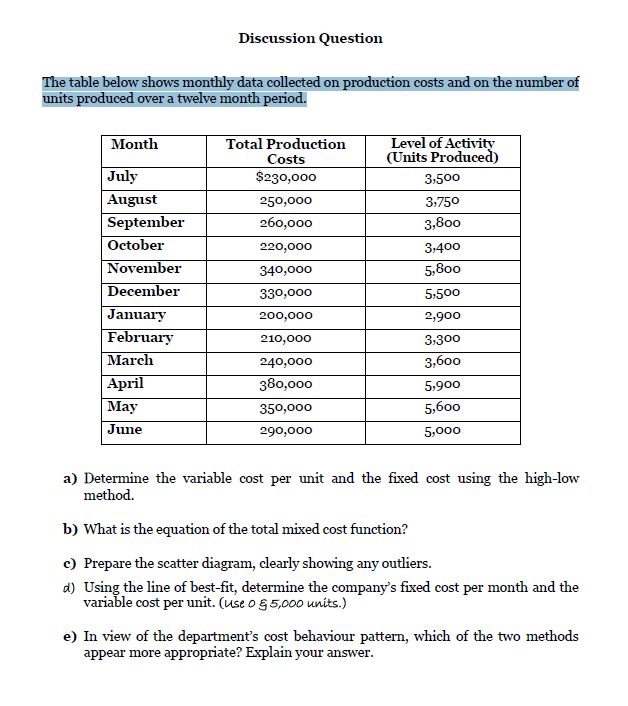
Discussion Question The table below shows monthly data collected on production costs and on the number of units produced over a twelve month period. Month Total Production Costs $230,000 250,000 260,000 220,000 340,000 330,000 July August September October November December January February March April May June Level of Activity (Units Produced) 3,500 3,750 3,800 3,400 5,800 5,500 2,900 3,300 3,600 5,900 5,600 5,000 200,000 210,000 240,000 380,000 350,000 290,000 a) Determine the variable cost per unit and the fixed cost using the high-low method. b) What is the equation of the total mixed cost function? c) Prepare the scatter diagram, clearly showing any outliers. d) Using the line of best-fit, determine the company's fixed cost per month and the variable cost per unit. (use o g 5,000 units.) e) In view of the department's cost behaviour pattern, which of the two methods appear more appropriate? Explain your
Step by Step Solution
There are 3 Steps involved in it

Get step-by-step solutions from verified subject matter experts