

Question: The table below shows monthly data collected on production costs and on the number of units produced over a tvelve month period. Mont Ju August
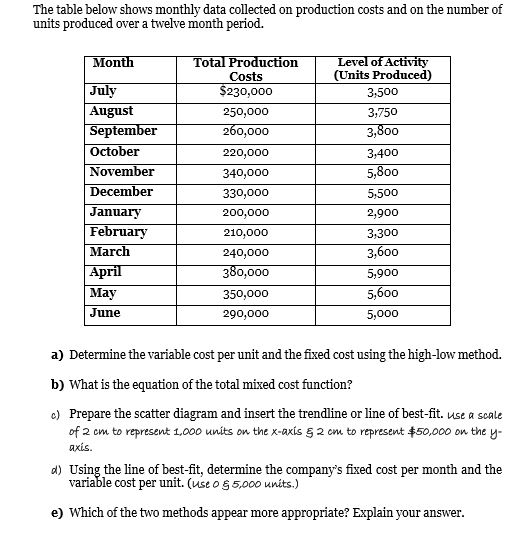
The table below shows monthly data collected on production costs and on the number of units produced over a tvelve month period. Mont Ju August Septem Octo Novem Total Production Costs 230,000 250,000 260,00O 220,000 340,000o 330,000o 200,000 210,000 240,000 380,000 350,000 290,000 0 vity (Units Produced) 3,500 3,750 3,400 5, 5,500 2,900 3,300 3: 5,900 5, 5,000 January February prl May June a) Determine the variable cost per unit and the fixed cost using the high-low method. b) What is the equation of the total mixed cost function? c) Prepare the scatter diagram and insert the trendline or line of best-fit. use a scale of 2 cm to represent 1,000 units on the x-axis 5 2 om to represent $50,000 on the y d) Using the line of best-fit, determine the company's fixed cost per month and the e cost per unit. (use o 5 5,000 units.) e) Which of the two methods appear more appropriate? Explain your
Step by Step Solution
There are 3 Steps involved in it

Get step-by-step solutions from verified subject matter experts