

Question: Discussion Question The table below shows monthly data collected on production costs and on the number of units produced over a twelve month period. a)
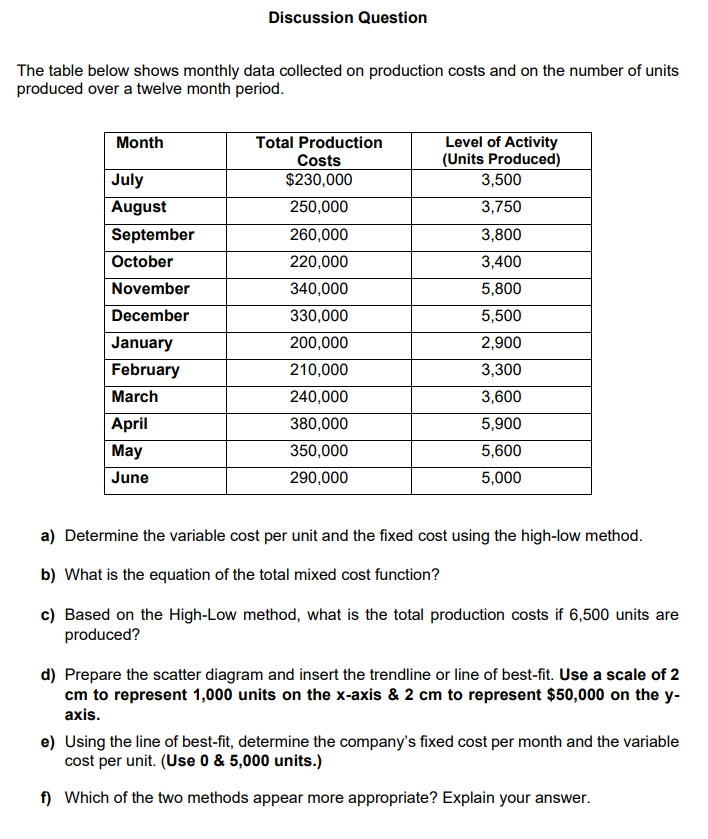
Discussion Question The table below shows monthly data collected on production costs and on the number of units produced over a twelve month period. a) Determine the variable cost per unit and the fixed cost using the high-low method. b) What is the equation of the total mixed cost function? c) Based on the High-Low method, what is the total production costs if 6,500 units are produced? d) Prepare the scatter diagram and insert the trendline or line of best-fit. Use a scale of 2 cm to represent 1,000 units on the x-axis &2cm to represent $50,000 on the y axis. e) Using the line of best-fit, determine the company's fixed cost per month and the variable cost per unit. (Use 0&5,000 units.) f) Which of the two methods appear more appropriate? Explain your
Step by Step Solution
There are 3 Steps involved in it

Get step-by-step solutions from verified subject matter experts