

Question: Do a market multiple analysis based on the assumptions below. 1. Determine the present value of the free cash flows New Tech expects over the
Do a market multiple analysis based on the assumptions below.
1. Determine the present value of the free cash flows New Tech expects over the next 5 years (FCF 5 NOPAT 2 investment in net operating working capital and fixed assets).
2. Determine the companys terminal value at the end of the 5 years and what that amount is worth today. To calculate the terminal value, assume an 8% growth rate of the free cash flows in perpetuity.
3. Calculate New Techs estimated market value by adding these two amounts: the present value of the free cash flows over the 5 years and the terminal value of the company at the end of the 5-year period.
Grant has determined that the appropriate risk-adjusted discount rate is 20%. Grant subjectively determined (with input from New Techs management) the 20% discount rate based on estimated required rates of return, as well as economic-, industry-, and company-specific risk factors.
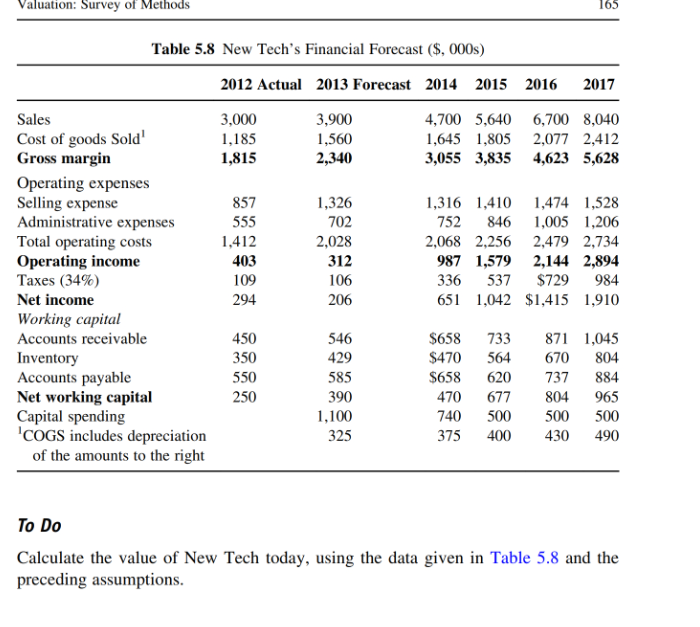
Valuation: Survey of Methods 165 Table 5.8 New Tech's Financial Forecast ($,000s) 2012 Actual 2013 Forecast 2014 2015 2016 2017 3,000 1,185 1,815 3,900 1,560 2,340 4,700 5,640 6,700 8,040 1,645 1,805 2,077 2,412 3,055 3,835 4,623 5,628 Sales Cost of goods Sold' Gross margin Operating expenses Selling expense Administrative expenses Total operating costs Operating income Taxes (34%) Net income Working capital Accounts receivable Inventory Accounts payable Net working capital Capital spending 'COGS includes depreciation of the amounts to the right 857 555 1,412 403 109 294 1,326 702 2,028 312 106 206 1,316 1,410 1,474 1,528 752 846 1,005 1,206 2,068 2,256 2,479 2,734 987 1,579 2,144 2,894 336 537 $729 984 651 1,042 $1,415 1,910 450 350 550 250 546 429 585 390 1,100 325 $658 $470 $658 470 740 375 733 564 620 677 500 400 871 1,045 670 804 737 884 804 965 500 500 430 490 To Do Calculate the value of New Tech today, using the data given in Table 5.8 and the preceding assumptions. Valuation: Survey of Methods 165 Table 5.8 New Tech's Financial Forecast ($,000s) 2012 Actual 2013 Forecast 2014 2015 2016 2017 3,000 1,185 1,815 3,900 1,560 2,340 4,700 5,640 6,700 8,040 1,645 1,805 2,077 2,412 3,055 3,835 4,623 5,628 Sales Cost of goods Sold' Gross margin Operating expenses Selling expense Administrative expenses Total operating costs Operating income Taxes (34%) Net income Working capital Accounts receivable Inventory Accounts payable Net working capital Capital spending 'COGS includes depreciation of the amounts to the right 857 555 1,412 403 109 294 1,326 702 2,028 312 106 206 1,316 1,410 1,474 1,528 752 846 1,005 1,206 2,068 2,256 2,479 2,734 987 1,579 2,144 2,894 336 537 $729 984 651 1,042 $1,415 1,910 450 350 550 250 546 429 585 390 1,100 325 $658 $470 $658 470 740 375 733 564 620 677 500 400 871 1,045 670 804 737 884 804 965 500 500 430 490 To Do Calculate the value of New Tech today, using the data given in Table 5.8 and the preceding assumptions
Step by Step Solution
There are 3 Steps involved in it

Get step-by-step solutions from verified subject matter experts