

Question: Do a Venn diagram using the following information A group of 250 college students were surveyed according to their choice of preference for a fast-food
Do a Venn diagram using the following information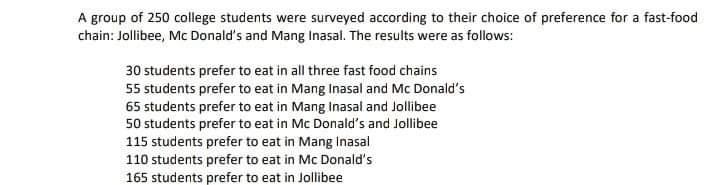
A group of 250 college students were surveyed according to their choice of preference for a fast-food chain: Jollibee, Mc Donald's and Mang Inasal. The results were as follows: 30 students prefer to eat in all three fast food chains 55 students prefer to eat in Mang Inasal and Mc Donald's 65 students prefer to eat in Mang Inasal and Jollibee 50 students prefer to eat in Mc Donald's and Jollibee 115 students prefer to eat in Mang Inasal 110 students prefer to eat in Mc Donald's 165 students prefer to eat in Jollibee
Step by Step Solution
3.43 Rating (169 Votes )
There are 3 Steps involved in it
P No Total no of Colloge studenti u 250 Students profer to eat n all 3 D30 fast food chains ... View full answer

Get step-by-step solutions from verified subject matter experts