

Question: Do number C only. Table 6-3 Monthly Holding-Period Returns, eBay versus the S&P 500 Index, June 2014 through May 2015 (1 of 2) eBay Returns
Do number C only.
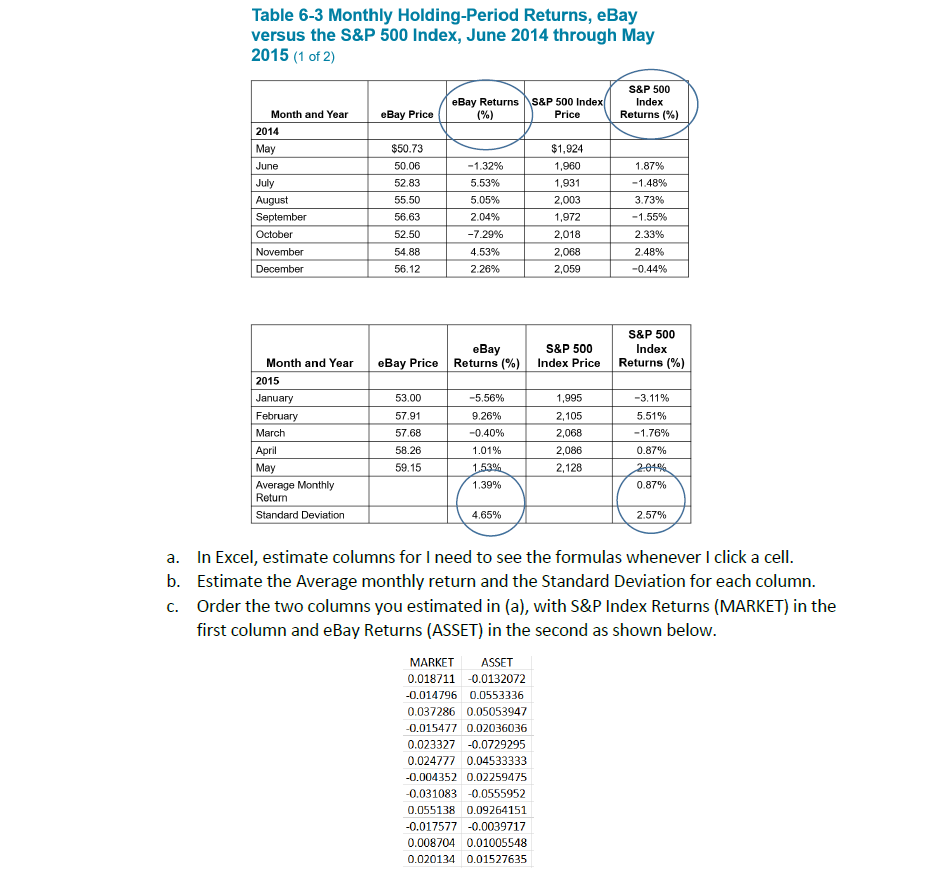
Table 6-3 Monthly Holding-Period Returns, eBay versus the S&P 500 Index, June 2014 through May 2015 (1 of 2) eBay Returns (%) S&P 500 Index Price S&P 500 Index Returns (%) eBay Price $50.73 50.06 Month and Year 2014 May June July August September October November December 52.83 55.50 56.63 52.50 54.88 56.12 -1.32% 5.53% 5.05% 2.04% -7.29% 4.53% 2.26% $1,924 1,960 1,931 2,003 1,972 2,018 2,068 2,059 1.87% -1.48% 3.73% -1.55% 2.33% 2.48% -0.44% S&P 500 Index Returns (%) eBay S&P 500 Returns (%) Index Price eBay Price 53.00 Month and Year 2015 January February March April May Average Monthly Return Standard Deviation 57.91 57.68 58.26 59.15 -5.56% 9.26% -0.40% 1.01% 1.53% 1.39% 1,995 2,105 2,068 2,086 2,128 -3.11% 5.51% -1.76% 0.87% 2.01% 0.87% 4.65% 2.57% a. In Excel, estimate columns for I need to see the formulas whenever I click a cell. b. Estimate the Average monthly return and the Standard Deviation for each column. C. Order the two columns you estimated in (a), with S&P Index Returns (MARKET) in the first column and eBay Returns (ASSET) in the second as shown below. MARKET ASSET 0.018711 -0.0132072 -0.014796 0.0553336 0.037286 0.05053947 -0.015477 0.02036036 0.023327 -0.0729295 0.024777 0.04533333 -0.004352 0.02259475 -0.031083 -0.0555952 0.055138 0.09264151 -0.017577 -0.0039717 0.008704 0.01005548 0.020134 0.01527635
Step by Step Solution
There are 3 Steps involved in it

Get step-by-step solutions from verified subject matter experts