

Question: Do the data represent good news or bad news regarding renewal trends? Why? Peter Finch looked at the numbers for the renewals of subscriptions to
Do the data represent good news or bad news regarding renewal trends? Why?
Peter Finch looked at the numbers for the renewals of subscriptions to Decision Analysis Monthly magazine. For both May and June he had figures for the percentage of expiring subscriptions that were gift subscriptions, promotional subscriptions, and from previous subscribers. Furthermore, his data showed what proportion of the expiring subscriptions in each category had been renewed.
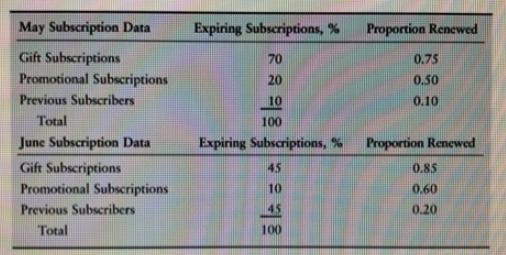
Finch was confused as he considered these numbers. Robert Calloway, who had assembled the data, had told him that the overall proportion of renewals had dropped from May to June. But the figures showed clearly that the proportion renewed had increased in each category. How could the overall proportion possibly have gone down? Peter got a pencil an pad of paper to check Calloway's figures. He had to report to his boss that afternoon and wanted to be able to tell him whether these figures represented good news or bad news.
May Subscription Data Expiring Subscriptions, % Proportion Renewed Gift Subscriptions Promotional Subscriptions 70 0.75 20 0.50 Previous Subscribers 10 0.10 Total 100 June Subscription Data Expiring Subscriptions, % Proportion Renewed Gift Subscriptions 45 0.85 Promotional Subscriptions 10 0.60 Previous Subscribers 45 0.20 Total 100
Step by Step Solution
3.48 Rating (158 Votes )
There are 3 Steps involved in it
The situation described is an example of Simpsons Paradox where trends that appear in different groups of data can disappear or reverse when the group... View full answer

Get step-by-step solutions from verified subject matter experts