

Question: Does the frequency with which a supermarket product is offered at a discount affect the price that customers expect to pay for the product? Does
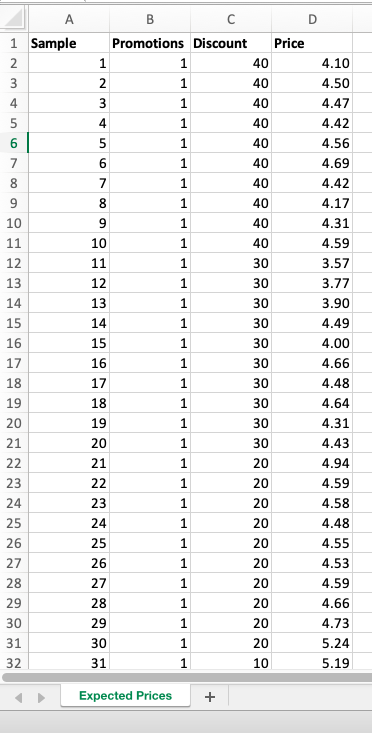
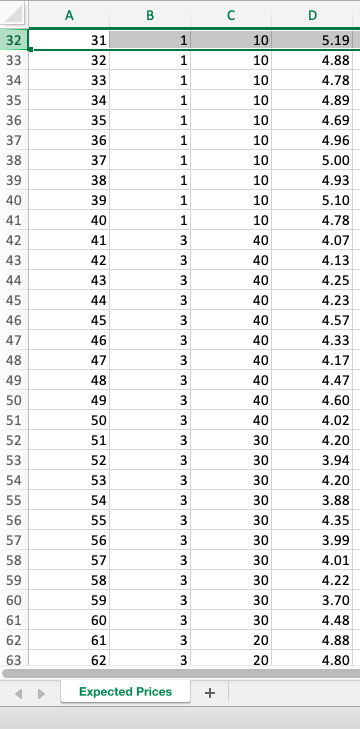
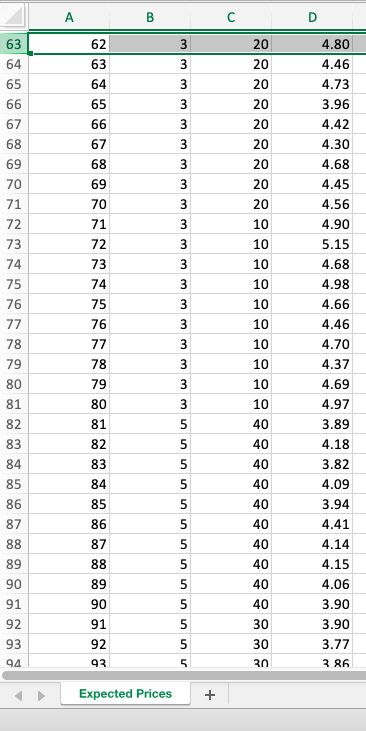
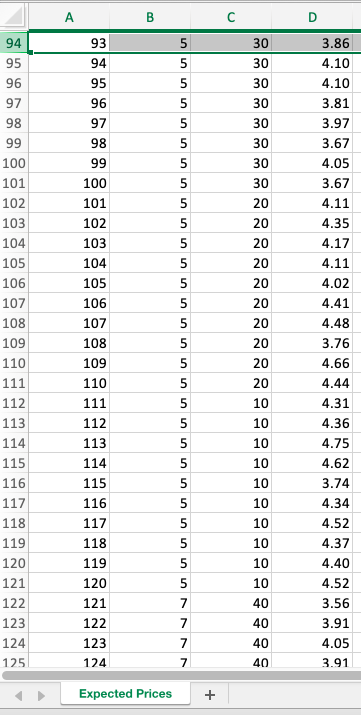
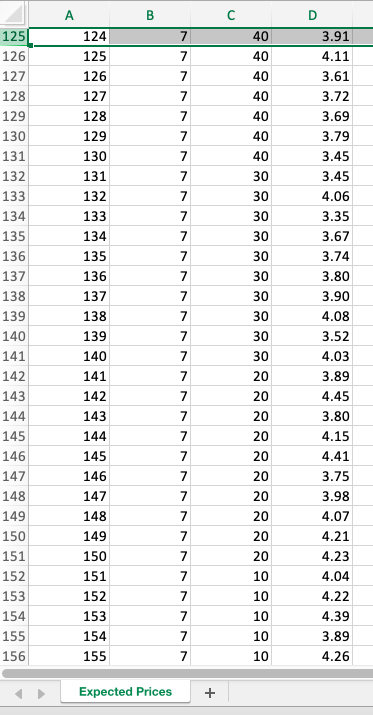
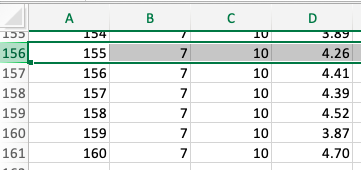
Does the frequency with which a supermarket product is offered at a discount affect the price that customers expect to pay for the product? Does the percent reduction also affect this expectation? These questions were examined by researchers in a study conducted on students enrolled in an introductory statistics course at a large Canadian university. For 10 weeks 160 subjects received information about the products. The treatment conditions corresponded to the number of promotions (1, 3, 5, or 7) during this 10-week period and the percent that the product was discounted (10%, 20%, 30%, and 40%). Ten students were randomly assigned to each of the 44 = 16 treatments. The expected price data is contained in worksheet eprice in file Assign3data.xlsx. (attached).
a) Identify the experimental design.
b) Use software to plot the treatment means in an interaction plot and describe the essential features of the data in terms of main effects and interaction.
c) Do the data provide sufficient evidence to indicate an interaction between promotions and discount? Conduct the appropriate test. Please provide:
? Hypotheses
? Value of test statistic, to two decimal places
? The critical value for the corresponding test statistic at ? = .05 (include degrees of freedom)
? Exact p-value using software
? Conclusion; don't simply say "reject" or "do not reject"; include a statement with practical meaning
d) Based on your answer to part (c), does it make sense to test the effect of promotions or the effect of discount level on the mean expected price? If so, are these effects significant? Justify your answers.
e) Plot the residuals against the fitted values. What key model assumptions can be examined and do these appear to be warranted?
f) Calculate the Bonferroni margin of error for the confidence intervals based on all the pairwise differences between the 16 treatment means. Assume an overall 95% confidence level. Using the calculated margin of error and a confidence interval approach, test whether the mean expected price is different for the following comparisons
? For a discount of 10%, 1 promotion versus 3 promotions;
? For 7 promotions, a 10% discount versus a 20% discount.
\f\f\f\f\f\f
Step by Step Solution
There are 3 Steps involved in it

Get step-by-step solutions from verified subject matter experts