

Question: Does this explain why the NPV and price target estimates by the different analysts was fairly close even though they had very different FCF forecasts?
Does this explain why the NPV and price target estimates by the different analysts was fairly close even though they had very different FCF forecasts? Explain.
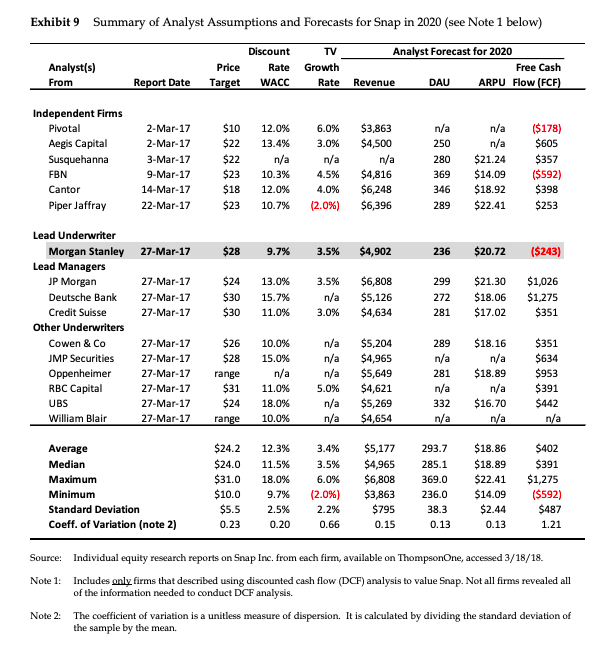
Exhibit 9 Summary of Analyst Assumptions and Forecasts for Snap in 2020 (see Note 1 below) TV Analyst(s) From Price Target Discount Rate WACC Growth Rate Analyst Forecast for 2020 Free Cash Revenue DAU ARPU Flow (FCF) Report Date $3,863 $4,500 Independent Firms Pivotal Aegis Capital Susquehanna FBN Cantor Piper Jaffray n/a 2-Mar-17 2-Mar-17 3-Mar-17 9-Mar-17 14-Mar-17 22-Mar-17 $10 $22 $22 $23 $18 $23 12.0% 13.4% n/a 10.3% 12.0% 10.7% 6.0% 3.0% n/a 4.5% 4.0% (2.0%) n/a 250 280 369 346 289 n/a n/a $21.24 $14.09 $18.92 $22.41 ($178) $605 $357 ($592) $398 $253 $4,816 $6.248 $6,396 27-Mar-17 $28 9.7% 3.5% $4,902 236 $20.72 ($243) 27-Mar-17 27-Mar-17 27-Mar-17 $24 $30 $30 13.0% 15.7% 11.0% 3.5% n/a 3.0% $6,808 $5,126 $4,634 299 272 281 $21.30 $18.06 $17.02 $1,026 $1,275 $351 Lead Underwriter Morgan Stanley Lead Managers JP Morgan Deutsche Bank Credit Suisse Other Underwriters Cowen & Co JMP Securities Oppenheimer RBC Capital UBS William Blair n/a 289 $18.16 n/a n/a wa n/a $18.89 27-Mar-17 27-Mar-17 27-Mar-17 27-Mar-17 27-Mar-17 27-Mar-17 $26 $28 range $31 $24 range 10.0% 15.0% n/a 11.0% 18.0% 10.0% $5,204 $4,965 $5,649 $4,621 $5,269 $4,654 $351 $634 $953 $391 $442 n/a n/a 281 n/a 332 n/a 5.0% n/a n/a $16.70 n/a Average Median Maximum Minimum Standard Deviation Coeff. of Variation (note 2) $24.2 $24.0 $31.0 $10.0 $5.5 12.3% 11.5% 18.0% 9.7% 2.5% 0.20 3.4% 3.5% 6.0% (2.0%) 2.2% 0.66 $5,177 293.7 $4,965285.1 $6,808 369.0 $3,863 236.0 $795 38.3 0.15 0.13 $18.86 $18.89 $22.41 $14.09 $2.44 0.13 $402 $391 $1,275 ($592) $487 1.21 0.23 Source: Individual equity research reports on Snap Inc. from each firm, available on Thompson One, accessed 3/18/18. Note 1: Includes only firms that described using discounted cash flow (DCF) analysis to value Snap. Not all firms revealed all of the information needed to conduct DCF analysis. Note 2: The coefficient of variation is a unitless measure of dispersion. It is calculated by dividing the standard deviation of the sample by the mean
Step by Step Solution
There are 3 Steps involved in it

Get step-by-step solutions from verified subject matter experts