

Question: does this help? Excel Analytics 12-1 (Static) Part 2 2. Go to the tab titled Template B: o. Use VLOOKUP to identify the proper quality
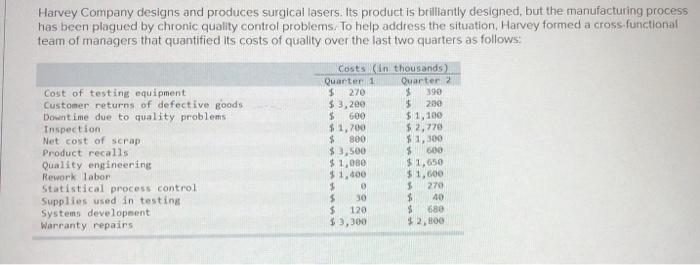
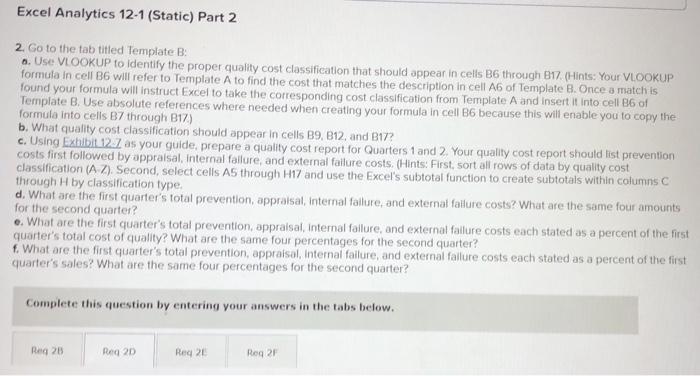
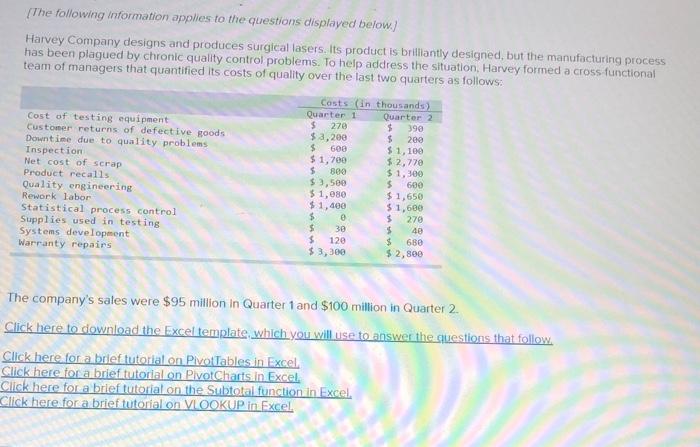
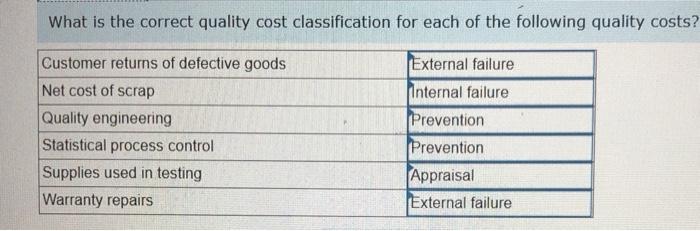
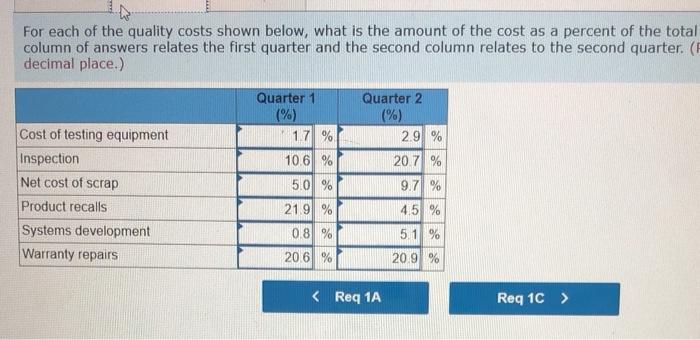
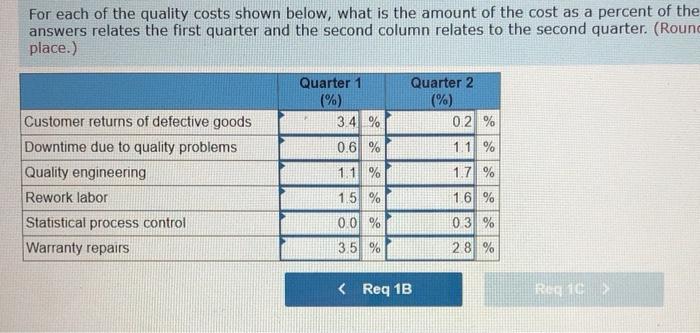
Excel Analytics 12-1 (Static) Part 2 2. Go to the tab titled Template B: o. Use VLOOKUP to identify the proper quality cost classification that should appear in cells B6 through 817. (Hints: Your VLOOKUP formula in cell B6 will refer to Template A to find the cost that matches the description in cell A6 of Template B. Once a match is found your formula will instruct Excel to take the corresponding cost classification from Template A and insert it into cell 86 of Template B. Use absolute references where needed when creating your formula in cell B6 because this will enable you to copy the formula into cells B7 through B17) b. What quality cost classification should appear in cells B9, B12, and B17? c. Using Exhibit 12. as your guide, prepare a quality cost report for Quarters 1 and 2. Your quality cost report should list prevention costs first followed by appraisal , internal failure, and external failure costs. (Hints: First, sort all rows of data by quality cost classification (AZ). Second, select cells AS through H17 and use the Excel's subtotal function to create subtotals within columns through H by classification type. d. What are the first quarter's total prevention, appraisal, Internal fallure, and external failure costs? What are the same four amounts for the second quarter? e. What are the first quarter's total prevention, appraisal, Internal failure, and external fallure costs tated as a percent of the first quarter's total cost of quality? What are the same four percentages for the second quarter? f. What are the first quarter's total prevention, appraisal Internal failure, and external fallure costs each stated as a percent of the first quarter's sales? What are the same four percentages for the second quarter? Complete this question by entering your answers in the tabs below. Reg 28 Reg 2D Red 20 Reg 2 What is the correct quality cost classification for each of the following quality costs? Customer returns of defective goods Net cost of scrap Quality engineering Statistical process control Supplies used in testing Warranty repairs External failure Internal failure Prevention Prevention Appraisal External failure For each of the quality costs shown below, what is the amount of the cost as a percent of the total column of answers relates the first quarter and the second column relates to the second quarter. ( decimal place.) Cost of testing equipment Inspection Net cost of scrap Product recalls Sy development Warranty repairs Quarter 1 (%) 17 % 10.6 % 5.0 % 21.9% Quarter 2 (%) 29 % 20.7 % 9.7 % 4.5 % 51 % 20.9% 0.8 % 20.6 % For each of the quality costs shown below, what is the amount of the cost as a percent of the answers relates the first quarter and the second column relates to the second quarter. (Round place.) Quarter 1 (%) 3.4 % 0.6 % Quarter 2 (%) 0.2 % 1.1 % 11 % Customer returns of defective goods Downtime due to quality problems Quality engineering Rework labor Statistical process control Warranty repairs 1.7 % 16 % 1.5 % 00% 03 % 3.5 % 28 % Excel Analytics 12-1 (Static) Part 2 2. Go to the tab titled Template B: o. Use VLOOKUP to identify the proper quality cost classification that should appear in cells B6 through 817. (Hints: Your VLOOKUP formula in cell B6 will refer to Template A to find the cost that matches the description in cell A6 of Template B. Once a match is found your formula will instruct Excel to take the corresponding cost classification from Template A and insert it into cell 86 of Template B. Use absolute references where needed when creating your formula in cell B6 because this will enable you to copy the formula into cells B7 through B17) b. What quality cost classification should appear in cells B9, B12, and B17? c. Using Exhibit 12. as your guide, prepare a quality cost report for Quarters 1 and 2. Your quality cost report should list prevention costs first followed by appraisal , internal failure, and external failure costs. (Hints: First, sort all rows of data by quality cost classification (AZ). Second, select cells AS through H17 and use the Excel's subtotal function to create subtotals within columns through H by classification type. d. What are the first quarter's total prevention, appraisal, Internal fallure, and external failure costs? What are the same four amounts for the second quarter? e. What are the first quarter's total prevention, appraisal, Internal failure, and external fallure costs tated as a percent of the first quarter's total cost of quality? What are the same four percentages for the second quarter? f. What are the first quarter's total prevention, appraisal Internal failure, and external fallure costs each stated as a percent of the first quarter's sales? What are the same four percentages for the second quarter? Complete this question by entering your answers in the tabs below. Reg 28 Reg 2D Red 20 Reg 2 What is the correct quality cost classification for each of the following quality costs? Customer returns of defective goods Net cost of scrap Quality engineering Statistical process control Supplies used in testing Warranty repairs External failure Internal failure Prevention Prevention Appraisal External failure For each of the quality costs shown below, what is the amount of the cost as a percent of the total column of answers relates the first quarter and the second column relates to the second quarter. ( decimal place.) Cost of testing equipment Inspection Net cost of scrap Product recalls Sy development Warranty repairs Quarter 1 (%) 17 % 10.6 % 5.0 % 21.9% Quarter 2 (%) 29 % 20.7 % 9.7 % 4.5 % 51 % 20.9% 0.8 % 20.6 % For each of the quality costs shown below, what is the amount of the cost as a percent of the answers relates the first quarter and the second column relates to the second quarter. (Round place.) Quarter 1 (%) 3.4 % 0.6 % Quarter 2 (%) 0.2 % 1.1 % 11 % Customer returns of defective goods Downtime due to quality problems Quality engineering Rework labor Statistical process control Warranty repairs 1.7 % 16 % 1.5 % 00% 03 % 3.5 % 28 %
Step by Step Solution
There are 3 Steps involved in it

Get step-by-step solutions from verified subject matter experts