

Question: Don't really get this problem uestions Using your favorite statistics software package, you generate a scatter plot with a regression equation and correlation Q1 [1/1]
Don't really get this problem
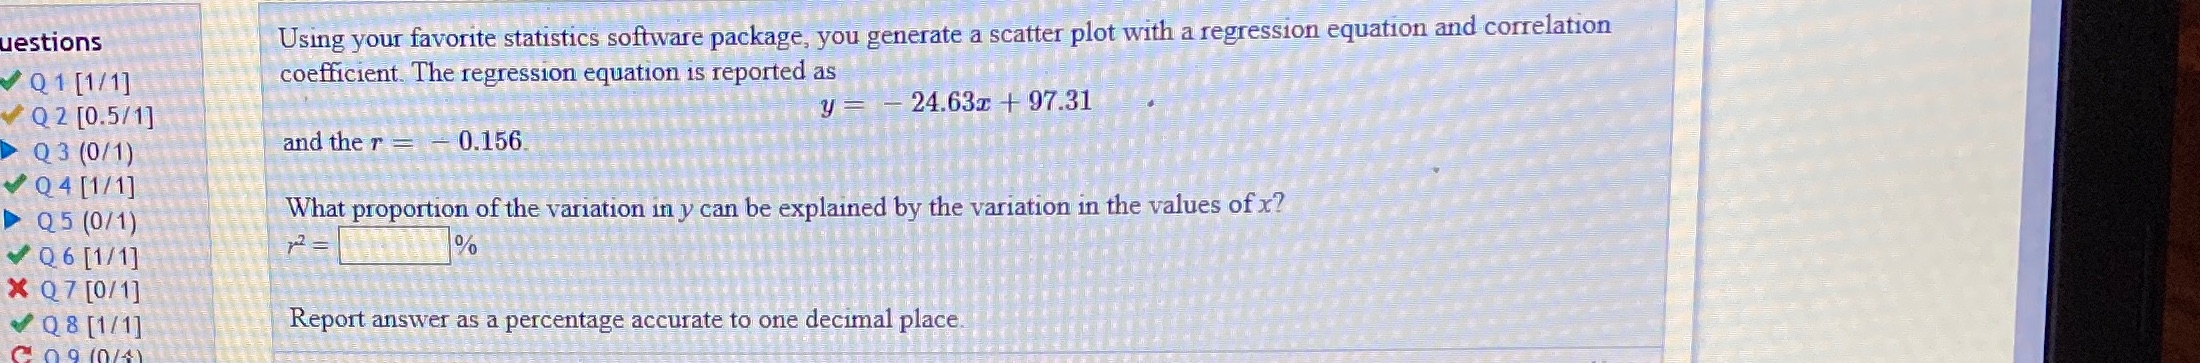
uestions Using your favorite statistics software package, you generate a scatter plot with a regression equation and correlation Q1 [1/1] coefficient. The regression equation is reported as Q2 [0.5/1] -24.63x + 97.31 Q3 (0/1) and the r = - 0.156. Q4[1/1] Q5 (0/1) What proportion of the variation in y can be explained by the variation in the values of x? Q6 [1/1] 12 =% x Q7 [0/ 1] Q 8 [1/1] Report answer as a percentage accurate to one decimal place
Step by Step Solution
There are 3 Steps involved in it
1 Expert Approved Answer
Step: 1 Unlock

Question Has Been Solved by an Expert!
Get step-by-step solutions from verified subject matter experts
Step: 2 Unlock
Step: 3 Unlock