Question: dPlease show how to solve problems a through f. Financial data needed to solve problem has been included in exhibits - assume values if values
dPlease show how to solve problems "a" through "f." Financial data needed to solve problem has been included in exhibits - assume values if values are not given below.
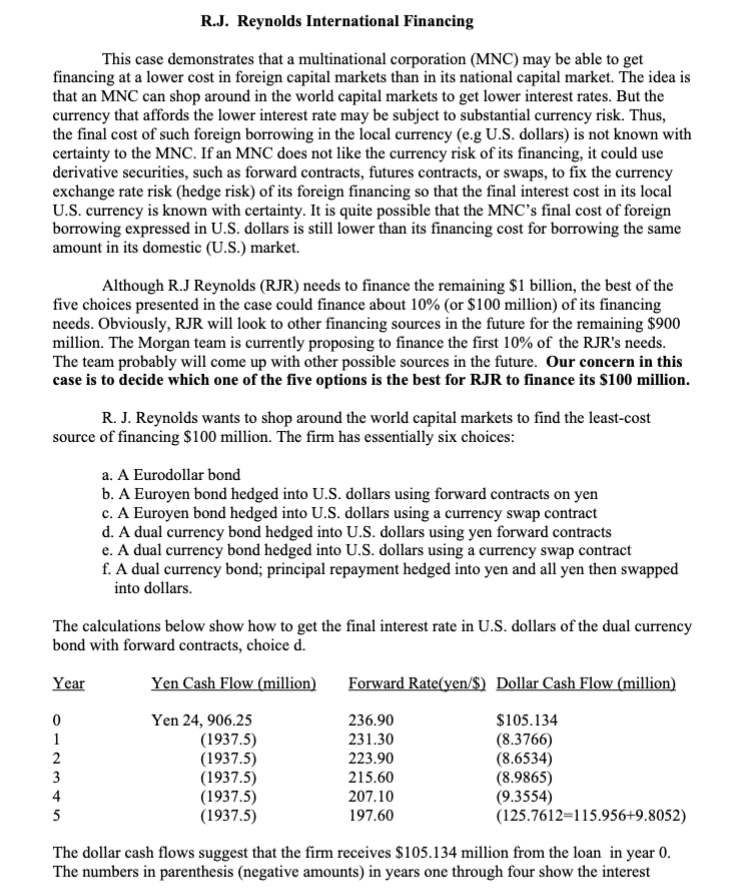
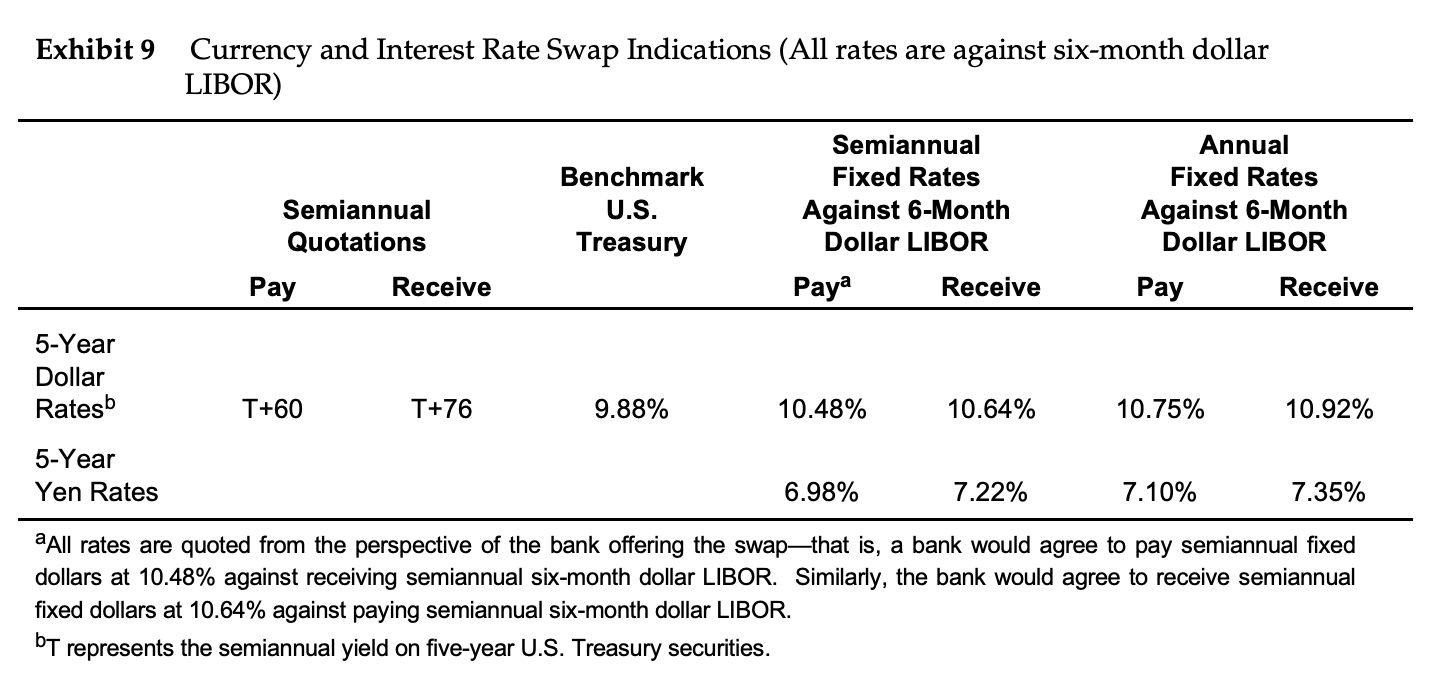
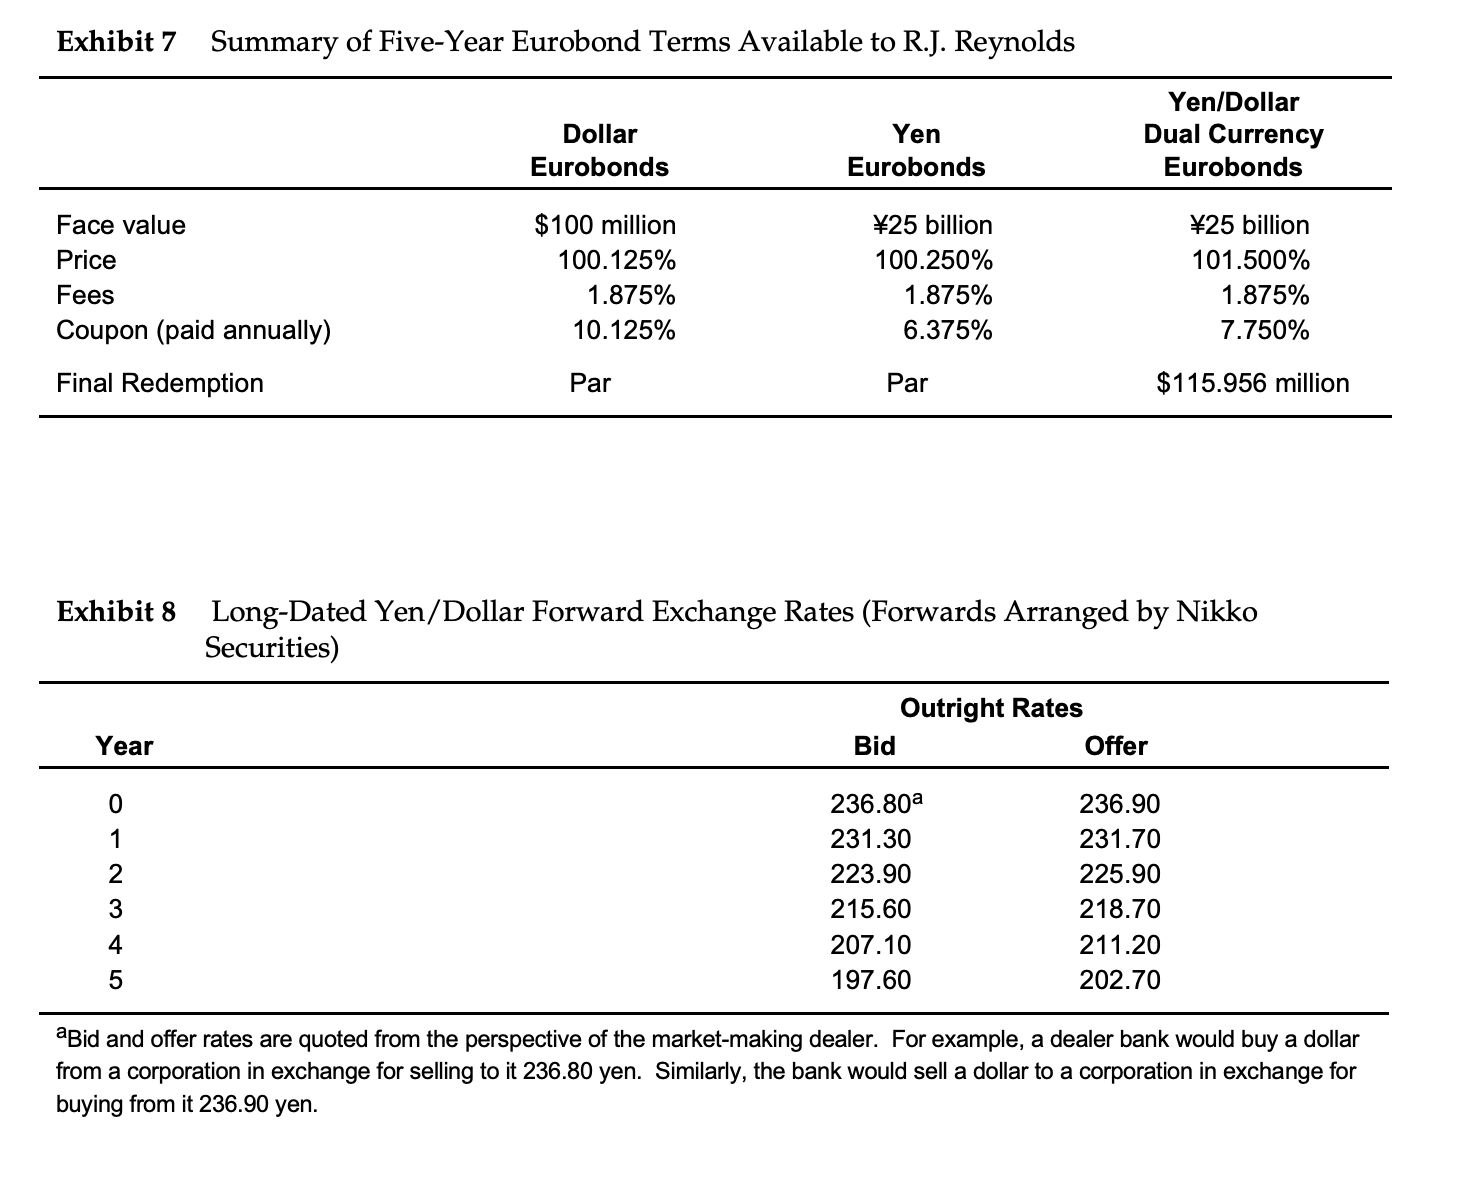
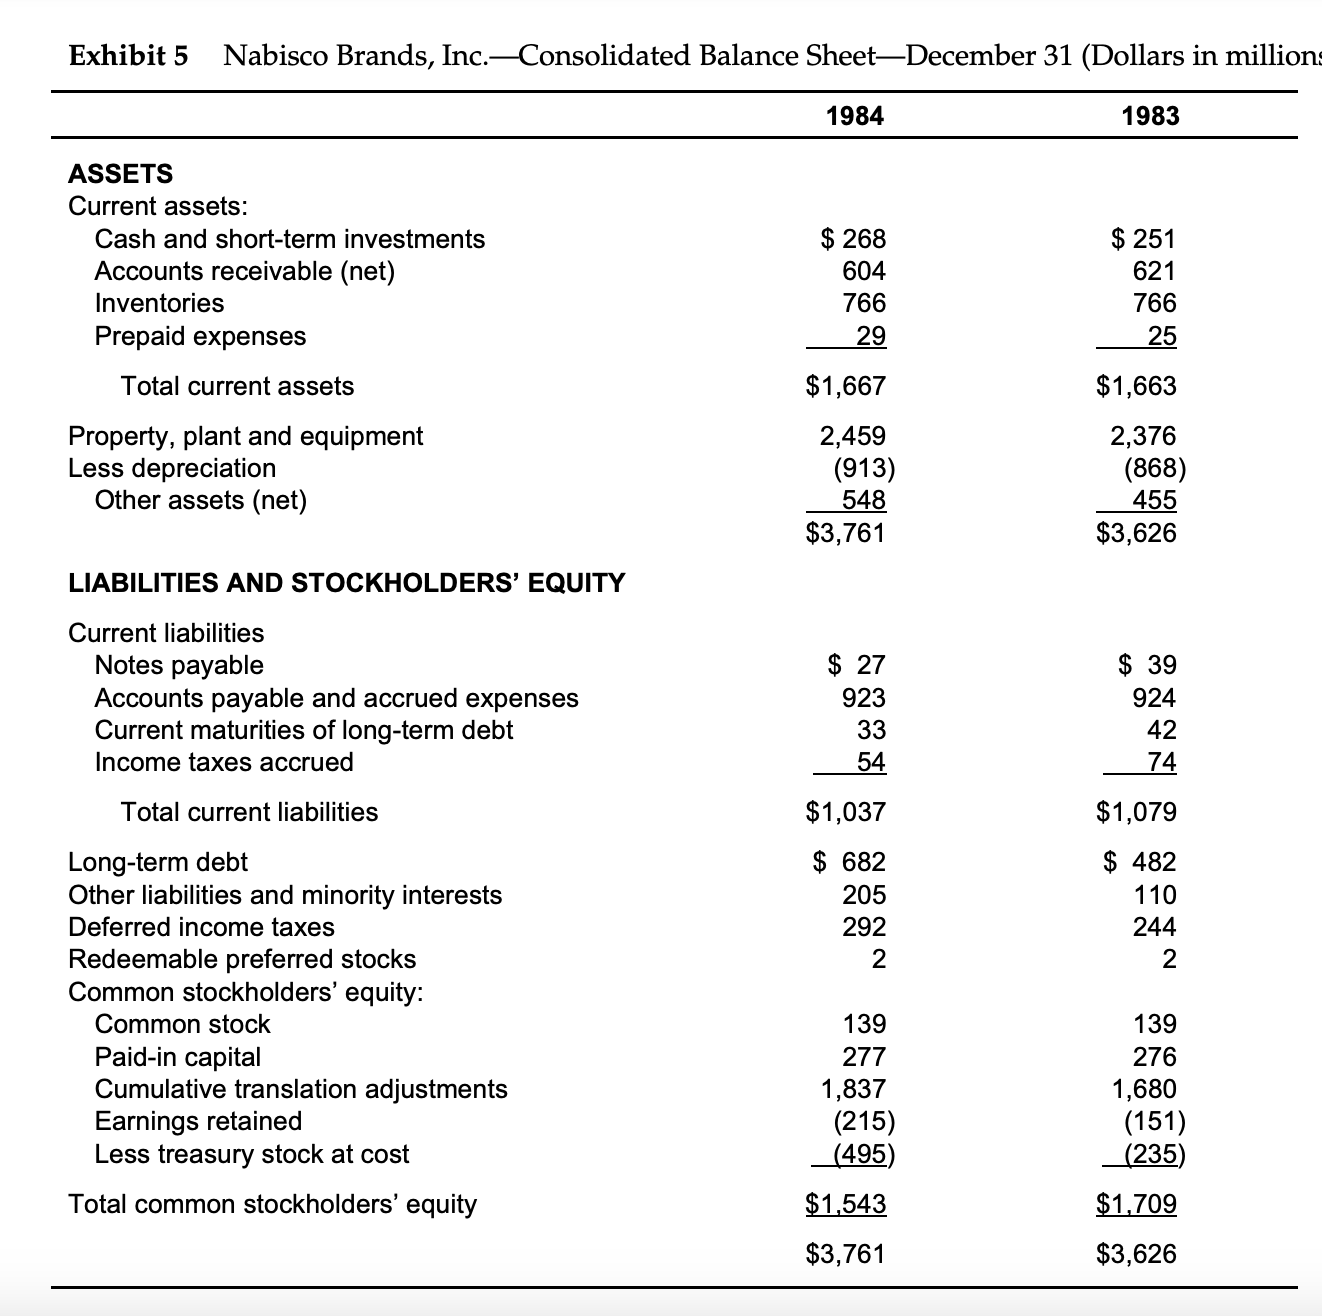
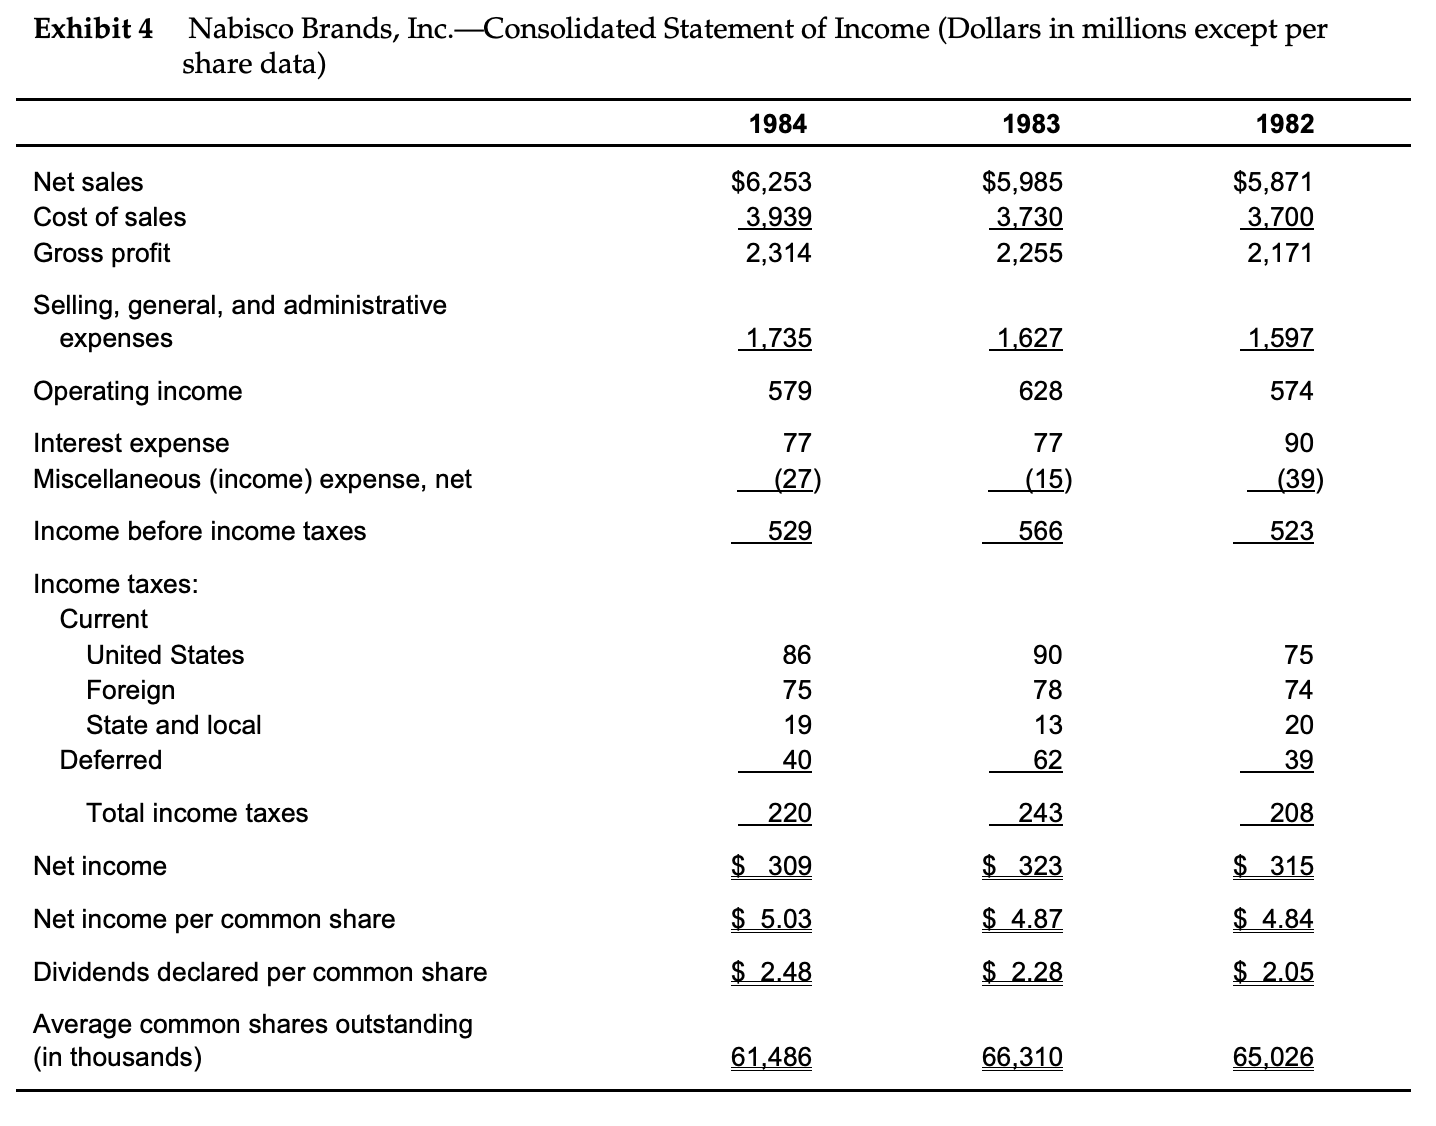
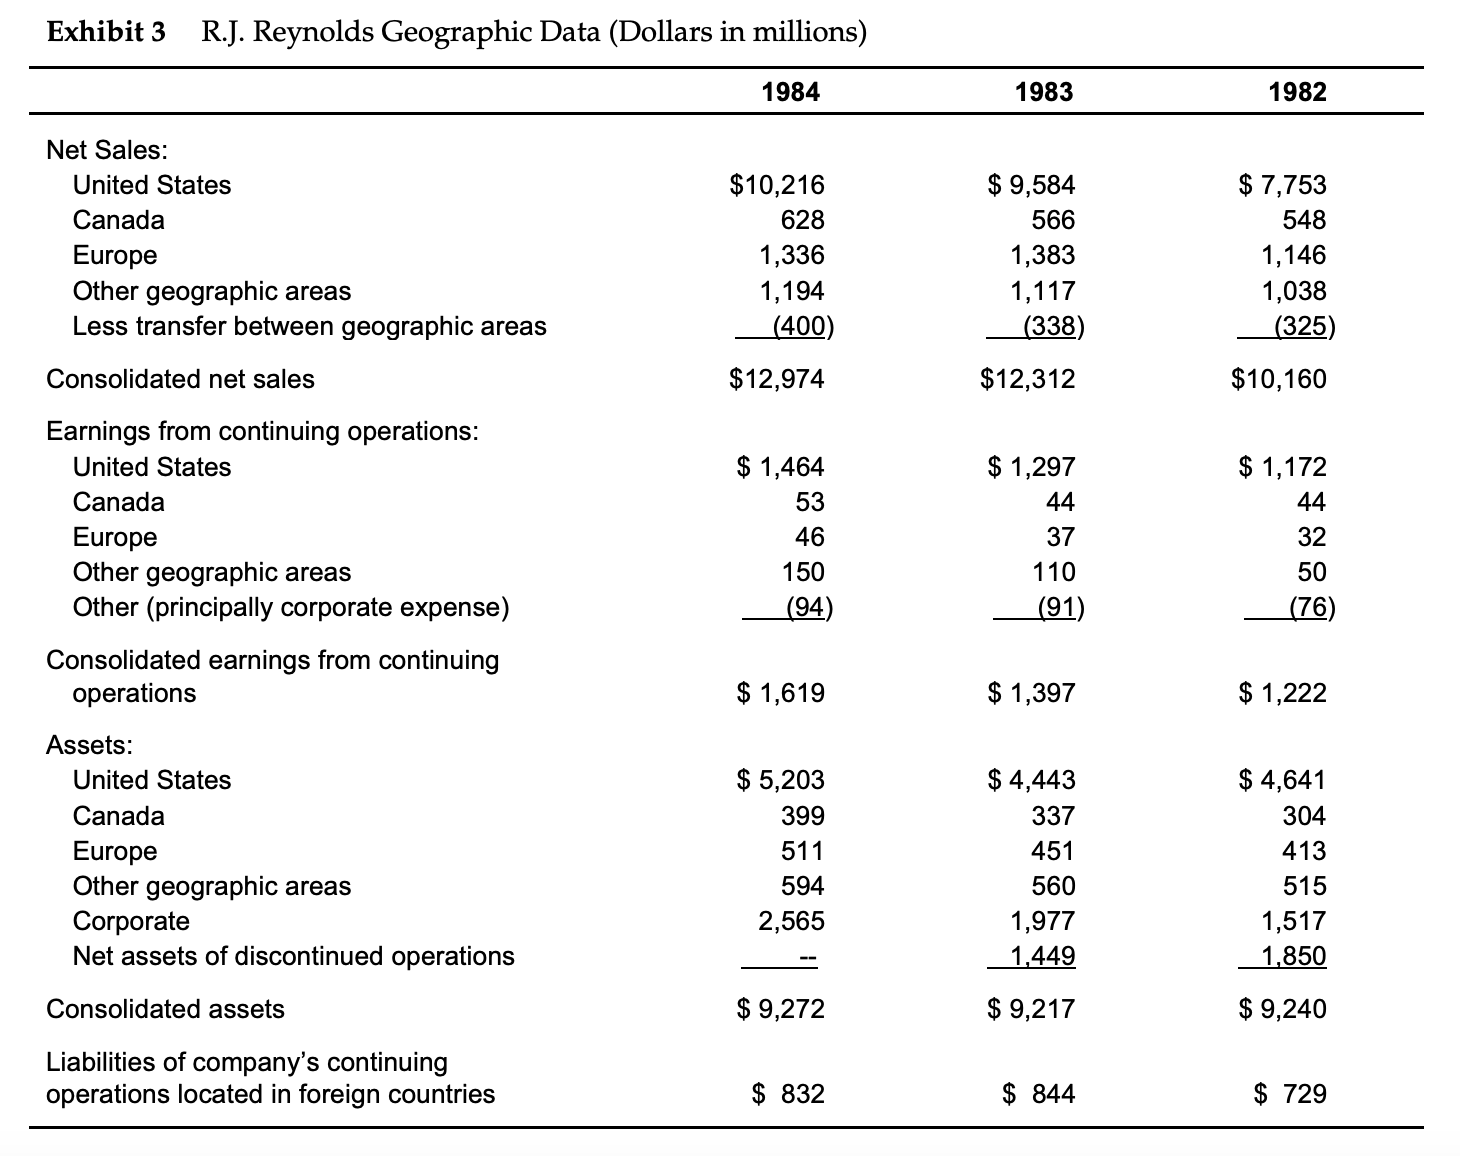
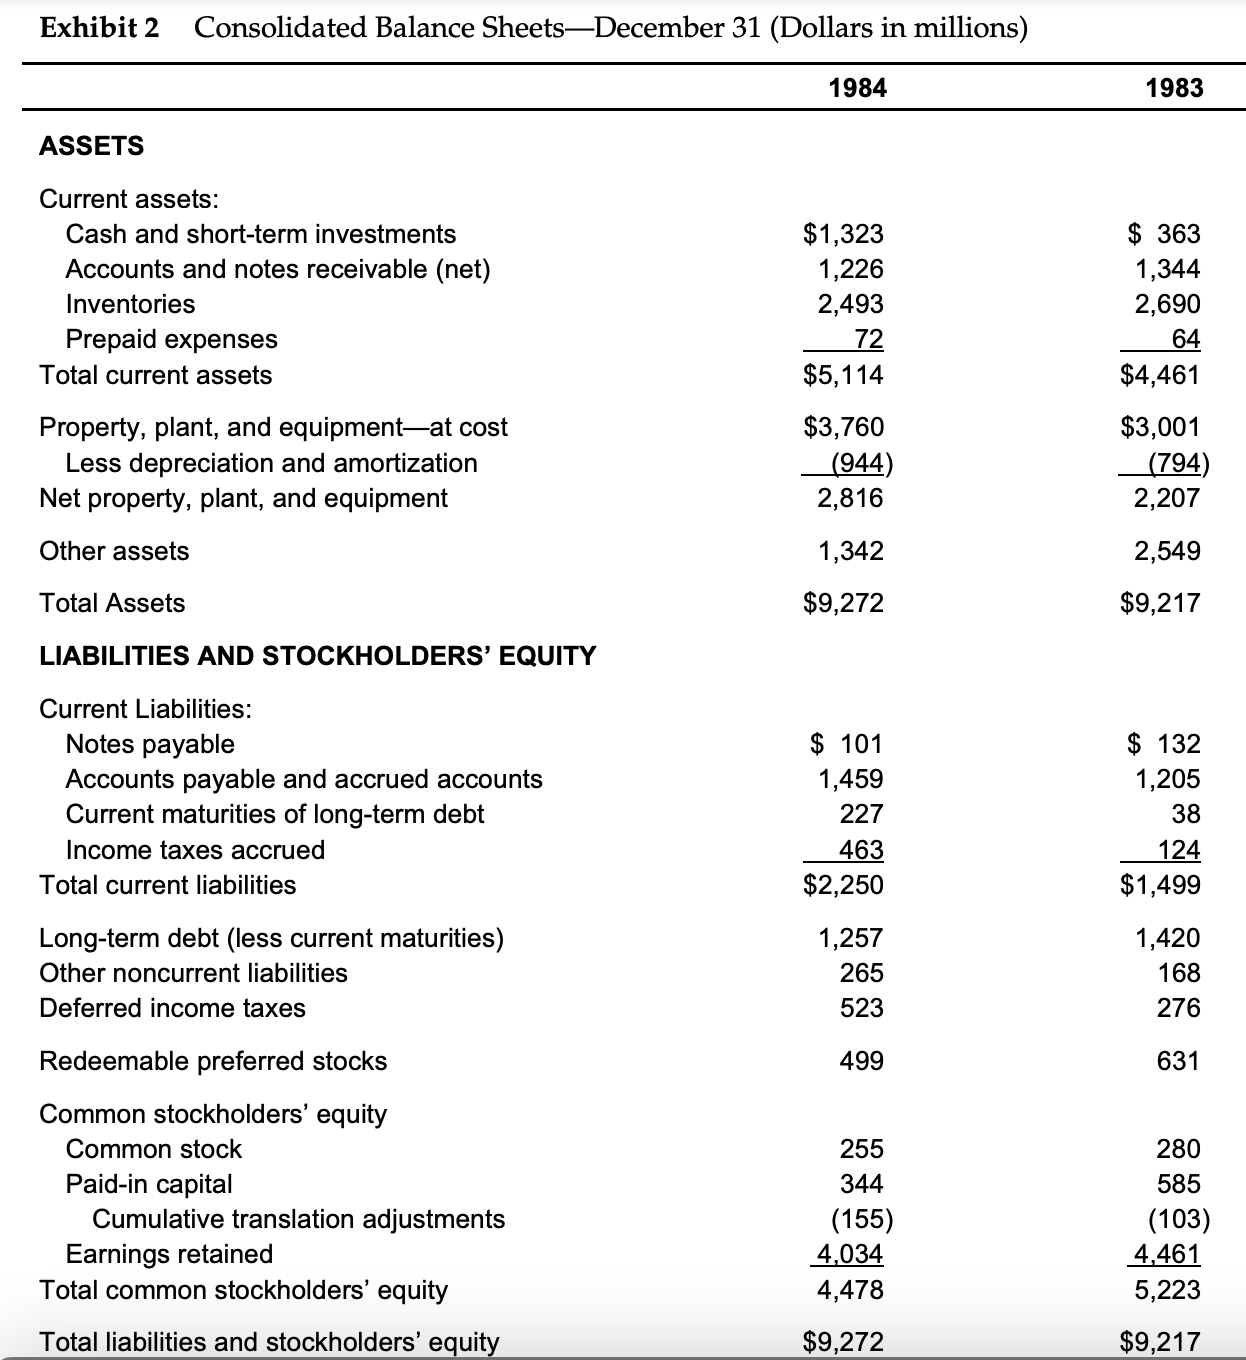
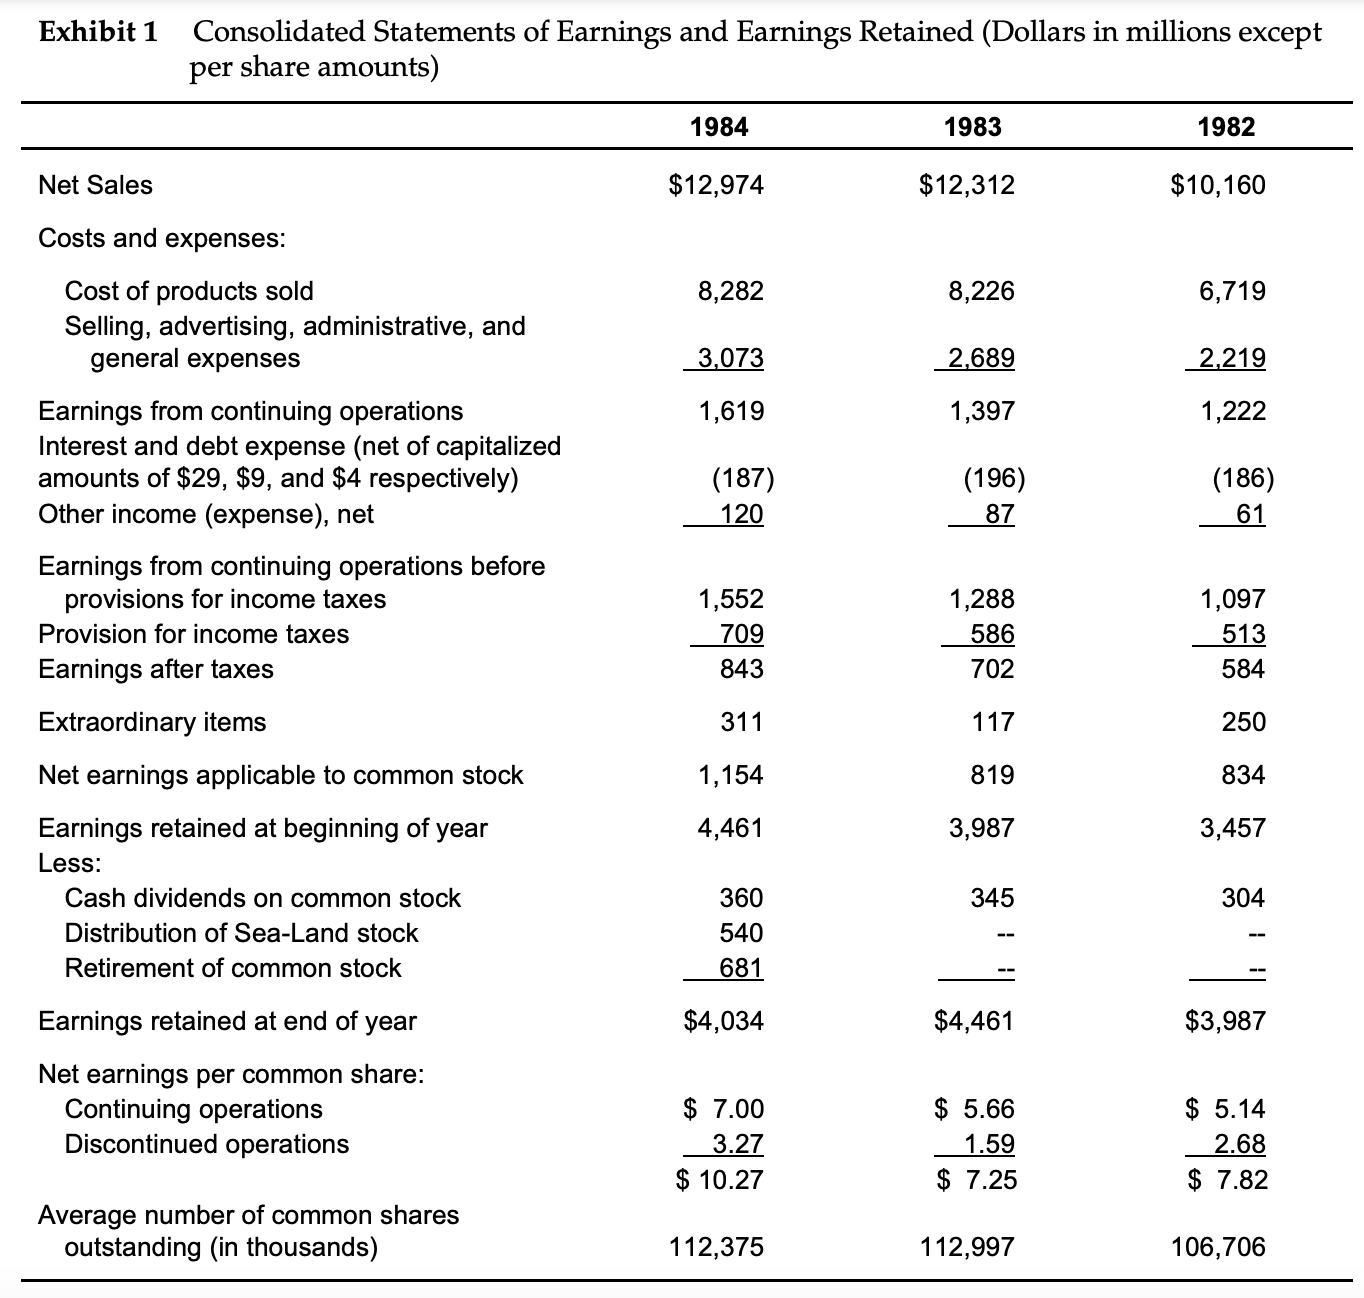
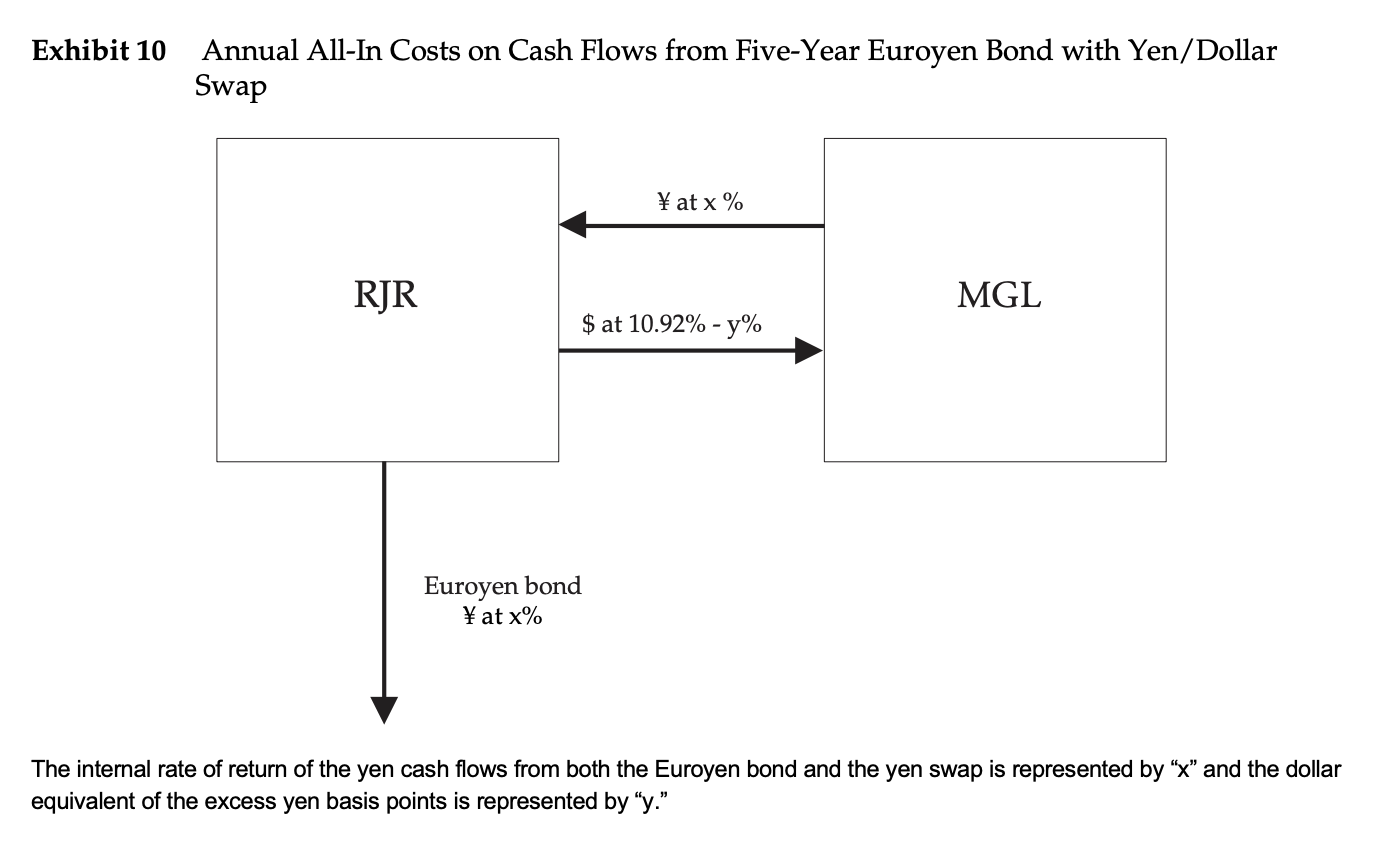
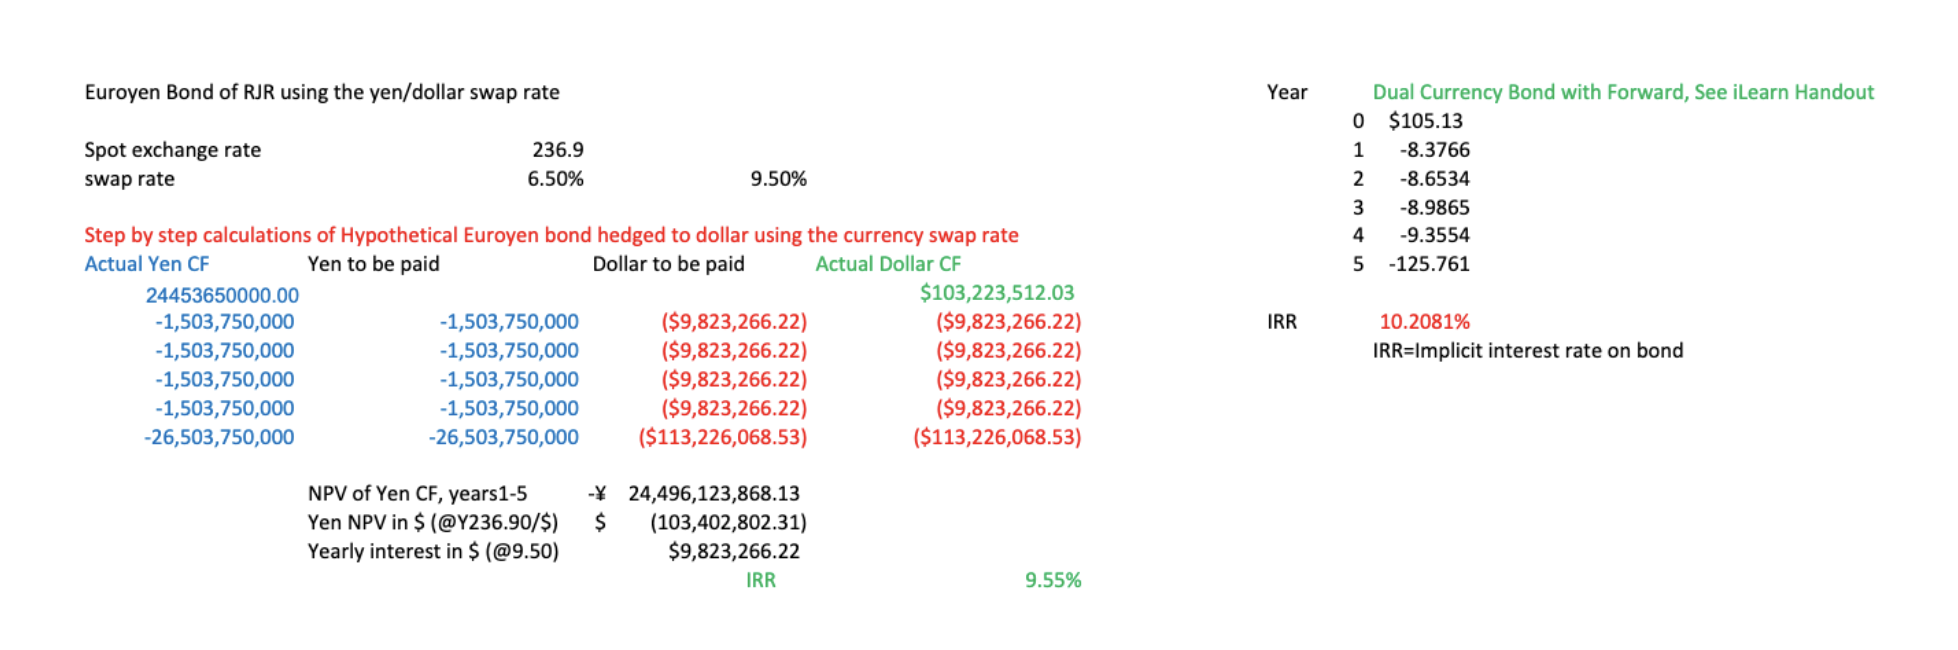
R.J. Reynolds International Financing This case demonstrates that a multinational corporation (MNC) may be able to get financing at a lower cost in foreign capital markets than in its national capital market. The idea is that an MNC can shop around in the world capital markets to get lower interest rates. But the currency that affords the lower interest rate may be subject to substantial currency risk. Thus, the final cost of such foreign borrowing in the local currency (e.g U.S. dollars) is not known with certainty to the MNC. If an MNC does not like the currency risk of its financing, it could use derivative securities, such as forward contracts, futures contracts, or swaps, to fix the currency exchange rate risk (hedge risk) of its foreign financing so that the final interest cost in its local U.S. currency is known with certainty. It is quite possible that the MNC's final cost of foreign borrowing expressed in U.S. dollars is still lower than its financing cost for borrowing the same amount in its domestic (U.S.) market. Although R.J Reynolds (RJR) needs to finance the remaining $1 billion, the best of the five choices presented in the case could finance about 10% (or $100 million) of its financing needs. Obviously, RJR will look to other financing sources in the future for the remaining $900 million. The Morgan team is currently proposing to finance the first 10% of the RJR's needs. The team probably will come up with other possible sources in the future. Our concern in this case is to decide which one of the five options is the best for RJR to finance its $100 million. R. J. Reynolds wants to shop around the world capital markets to find the least-cost source of financing $100 million. The firm has essentially six choices: a. A Eurodollar bond b. A Euroyen bond hedged into U.S. dollars using forward contracts on yen c. A Euroyen bond hedged into U.S. dollars using a currency swap contract d. A dual currency bond hedged into U.S. dollars using yen forward contracts e. A dual currency bond hedged into U.S. dollars using a currency swap contract f. A dual currency bond; principal repayment hedged into yen and all yen then swapped into dollars. The calculations below show how to get the final interest rate in U.S. dollars of the dual currency bond with forward contracts, choice d. Year Yen Cash Flow (million) Forward Rate(yen/$) Dollar Cash Flow (million) Yen 24, 906.25 236.90 $105.134 (1937.5) 231.30 (8.3766) (1937.5) 223.90 (8.6534) UAWNE (1937.5) 215.60 (8.9865) (1937.5) 207.10 (9.3554) (1937.5) 197.60 (125.7612=115.956+9.8052) The dollar cash flows suggest that the firm receives $105.134 million from the loan in year 0. The numbers in parenthesis (negative amounts) in years one through four show the interestExhibit 9 Currency and Interest Rate Swap Indications (All rates are against six-month dollar LIBOR) Semiannual Annual Benchmark Fixed Rates Fixed Rates Semiannual U.S. Against 6-Month Against 6-Month Quotations Treasury Dollar LIBOR Dollar LIBOR Pay Receive Paya Receive Pay Receive 5-Year Dollar Rates T+60 T+76 9.88% 10.48% 10.64% 10.75% 10.92% 5-Year Yen Rates 6.98% 7.22% 7.10% 7.35% All rates are quoted from the perspective of the bank offering the swap-that is, a bank would agree to pay semiannual fixed dollars at 10.48% against receiving semiannual six-month dollar LIBOR. Similarly, the bank would agree to receive semiannual fixed dollars at 10.64% against paying semiannual six-month dollar LIBOR. T represents the semiannual yield on five-year U.S. Treasury securities.Exhibit 7 Summary of Five-Year Eurobond Terms Available to R.J. Reynolds Yen/Dollar Dollar Yen Dual Currency Eurobonds Eurobonds Eurobonds Face value $100 million *25 billion *25 billion Price 100. 125% 100.250% 101.500% Fees 1.875% 1.875% 1.875% Coupon (paid annually) 10.125% 6.375% 7.750% Final Redemption Par Par $115.956 million Exhibit 8 Long-Dated Yen/Dollar Forward Exchange Rates (Forwards Arranged by Nikko Securities) Outright Rates Year Bid Offer 236.80a 236.90 231.30 231.70 223.90 225.90 U A W N - O 215.60 218.70 207.10 211.20 197.60 202.70 aBid and offer rates are quoted from the perspective of the market-making dealer. For example, a dealer bank would buy a dollar from a corporation in exchange for selling to it 236.80 yen. Similarly, the bank would sell a dollar to a corporation in exchange for buying from it 236.90 yen.Exhibit 6 Nabisco Geographic Data (Dollars in millions) 1984 1983 1982 Net Sales: United States $3,950 $3,622 $3,491 Canada 721 732 639 Europe 1, 102 1,138 782 Latin America 290 298 374 Asia/Pacific 190 195 178 Other 407 Consolidated net sales $6,253 $5,985 $5,871 Earnings from continuing operations: United States $451 $475 $438 Canada 61 67 60 Europe 78 81 67 Latin America 53 58 57 Asia/Pacific 10 13 12 Other (principally corporate expense) (63) (66) (60) Consolidated earnings from continuing operations $590 $628 $574 Assets: United States $1,730 $1,659 $1,541 Canada 373 376 415 Europe 791 822 819 Latin America 197 191 259 Asia/Pacific 119 136 120 Corporate 551 442 770 Consolidated assets $3,761 $3,626 $3,924Exhibit 5 Nabisco Brands, IncConsolidated Balance SheetDecember 31 (Dollars in million: 1984 1983 ASSETS Current assets: Cash and short-term investments $ 268 $ 251 Accounts receivable (net) 604 621 Inventories 766 766 Prepaid expenses 29 25 Total current assets $1,667 $1,663 Property, plant and equipment 2,459 2,376 Less depreciation (913) (868) Other assets (net) 548 455 $3,761 $3,626 LIABILITIES AND STOCKHOLDERS' EQUITY Current liabilities Notes payable 8 27 $ 39 Accounts payable and accrued expenses 923 924 Current maturities of longterm debt 33 42 Income taxes accrued 54 74 Total current liabilities $1,037 $1,079 Long-term debt 5 682 $ 482 Other liabilities and minority interests 205 110 Deferred income taxes 292 244 Redeemable preferred stocks 2 2 Common stockholders' equity: Common stock 139 139 Paidin capital 277 276 Cumulative translation adjustments 1,837 1,680 Earnings retained (215) (151) Less treasury stock at cost (495) {235) Total common stockholders' equity $1,543 $1,709 $3.761 $3,626 Exhibit 4 Nabisco Brands, IncConsolidated Statement of Income (Dollars in millions except per share data) 1984 1983 1982 Net sales $6,253 $5,985 $5,871 Cost of sales 3,939 3,730 3,700 Gross profit 2,314 2,255 2,171 Selling, general, and administrative expenses 1,735 1,627 1,597 Operating income 579 628 574 Interest expense 77 77 90 Miscellaneous (income) expense, net (27) I15) I39) Income before income taxes 529 566 523 Income taxes: Current United States 86 90 75 Foreign 75 78 74 State and local 19 13 20 Deferred 40 62 39 Total income taxes 220 243 208 Net income $ 309 $ 323 $ 315 Net income per common share 5.03 $ 4.87 4 84 Dividends declared per common share |E |E |E Average common shares outstanding (in thousands) 0') d 4:. on G) N?) G) 00 _'L O NO) U'I D N on Exhibit 3 RJ. Reynolds Geographic Data (Dollars in millions) Net Sales: United States Canada Europe Other geographic areas Less transfer between geographic areas Consolidated net sales Earnings from continuing operations: United States Canada Europe Other geographic areas Other (principally corporate expense) Consolidated earnings from continuing operations Assets: United States Canada Europe Other geographic areas Corporate Net assets of discontinued operations Consolidated assets Liabilities of company's continuing operations located in foreign countries 1984 $10,216 628 1,336 1,194 (400) $12,974 $ 1,464 53 $ 5,203 399 511 594 2,565 $ 9,272 $ 832 1983 $ 9,584 566 1,383 1,117 (338) $12,312 $ 1,297 44 37 110 (91) $ 1,397 $ 4,443 337 451 560 1,977 1,449 $ 9,217 $ 344 1982 $ 7,753 548 1,146 1,038 (325) $10,160 $1,172 $ 4,641 304 413 515 1,517 1,850 $ 9,240 $ 729 Exhibit 2 Consolidated Balance SheetsDecember 31 (Dollars in millions) 1984 1983 ASSETS Current assets: Cash and short-term investments $1,323 $ 363 Accounts and notes receivable (net) 1,226 1,344 Inventories 2,493 2,690 Prepaid expenses 72 64 Total current assets $5,114 $4,461 Property, plant, and equipmentat cost $3,760 $3,001 Less depreciation and amortization (944) (794) Net property, plant, and equipment 2,816 2,207 Other assets 1,342 2,549 Total Assets $9,272 $9,217 LIABILITIES AND STOCKHOLDERS' EQUITY Current Liabilities: Notes payable $ 101 $ 132 Accounts payable and accrued accounts 1,459 1,205 Current maturities of long-term debt 227 38 Income taxes accrued 463 124 Total current liabilities $2,250 $1,499 Longterm debt (less current maturities) 1,257 1,420 Other noncurrent liabilities 265 168 Deferred income taxes 523 276 Redeemable preferred stocks 499 631 Common stockholders' equity Common stock 255 280 Paidin capital 344 585 Cumulative translation adjustments (155) (103) Earnings retained 4,034 4,461 Total common stockholders' equity 4,478 5,223 Total liabilities and stockholders' equity $9,272 $9,217 Exhibit 1 Consolidated Statements of Earnings and Earnings Retained (Dollars in millions except per share amounts) 1984 1983 1982 Net Sales $12,974 $12,312 $10,160 Costs and expenses: Cost of products sold 8,282 8,226 6,719 Selling, advertising, administrative, and general expenses 3,073 2 689 2 219 Earnings from continuing operations 1,619 1,397 1,222 Interest and debt expense (net of capitalized amounts of $29, $9, and $4 respectively} (187) (196} (186} Other income (expense), net 120 87 61 Earnings from continuing operations before provisions for income taxes 1,552 1,288 1,097 Provision for income taxes 709 586 513 Earnings after taxes 843 702 584 Extraordinary items 311 117 250 Net earnings applicable to common stock 1,154 819 834 Earnings retained at beginning of year 4,461 3,987 3,457 Less: Cash dividends on common stock 360 345 304 Distribution of Sea-Land stock 540 -- -- Retirement of common stock 681 Earnings retained at end of year $4,034 $4,461 $3,987 Net earnings per common share: Continuing operations $ 7.00 $ 5.66 $ 5.14 Discontinued operations 3.27 1.59 2.68 $ 10.27 $ 7.25 $ 7.82 Average number of common shares outstanding (in thousands) 112,375 112,997 106,706 Exhibit 10 Annual All-In Costs on Cash Flows from Five-Year Euroyen Bond with Yen/Dollar Swap Y at x % RJR MGL $ at 10.92% - y% Euroyen bond Y at x% The internal rate of return of the yen cash flows from both the Euroyen bond and the yen swap is represented by "x" and the dollar equivalent of the excess yen basis points is represented by "y."Euroyen Bond of RJR using the yen/dollar swap rate Year Dual Currency Bond with Forward, See iLearn Handout $105.13 Spot exchange rate 236.9 -8.3766 swap rate 6.50% 9.50% -8.6534 UAWNH -8.9865 Step by step calculations of Hypothetical Euroyen bond hedged to dollar using the currency swap rate -9.3554 Actual Yen CF Yen to be paid Dollar to be paid Actual Dollar CF -125.761 24453650000.00 $103,223,512.03 -1,503,750,000 -1,503,750,000 ($9,823,266.22) ($9,823,266.22) IRR 10.2081% -1,503,750,000 -1,503,750,000 ($9,823,266.22) ($9,823,266.22) IRR=Implicit interest rate on bond -1,503,750,000 -1,503,750,000 ($9,823,266.22) ($9,823,266.22) -1,503,750,000 -1,503,750,000 ($9,823,266.22) ($9,823,266.22) -26,503,750,000 -26,503,750,000 ($113,226,068.53) ($113,226,068.53) NPV of Yen CF, years1-5 * 24,496,123,868.13 Yen NPV in $ (@Y236.90/$) $ (103,402,802.31) Yearly interest in $ (@9.50) $9,823,266.22 IRR 9.55%
Step by Step Solution
There are 3 Steps involved in it
1 Expert Approved Answer
Step: 1 Unlock
Question Has Been Solved by an Expert!
Get step-by-step solutions from verified subject matter experts
Step: 2 Unlock
Step: 3 Unlock
Students Have Also Explored These Related Finance Questions!