

Question: Draw a graph that shows the relationship between the two variables x and y: x 5 y 0 15. a. Is the relationship positive or
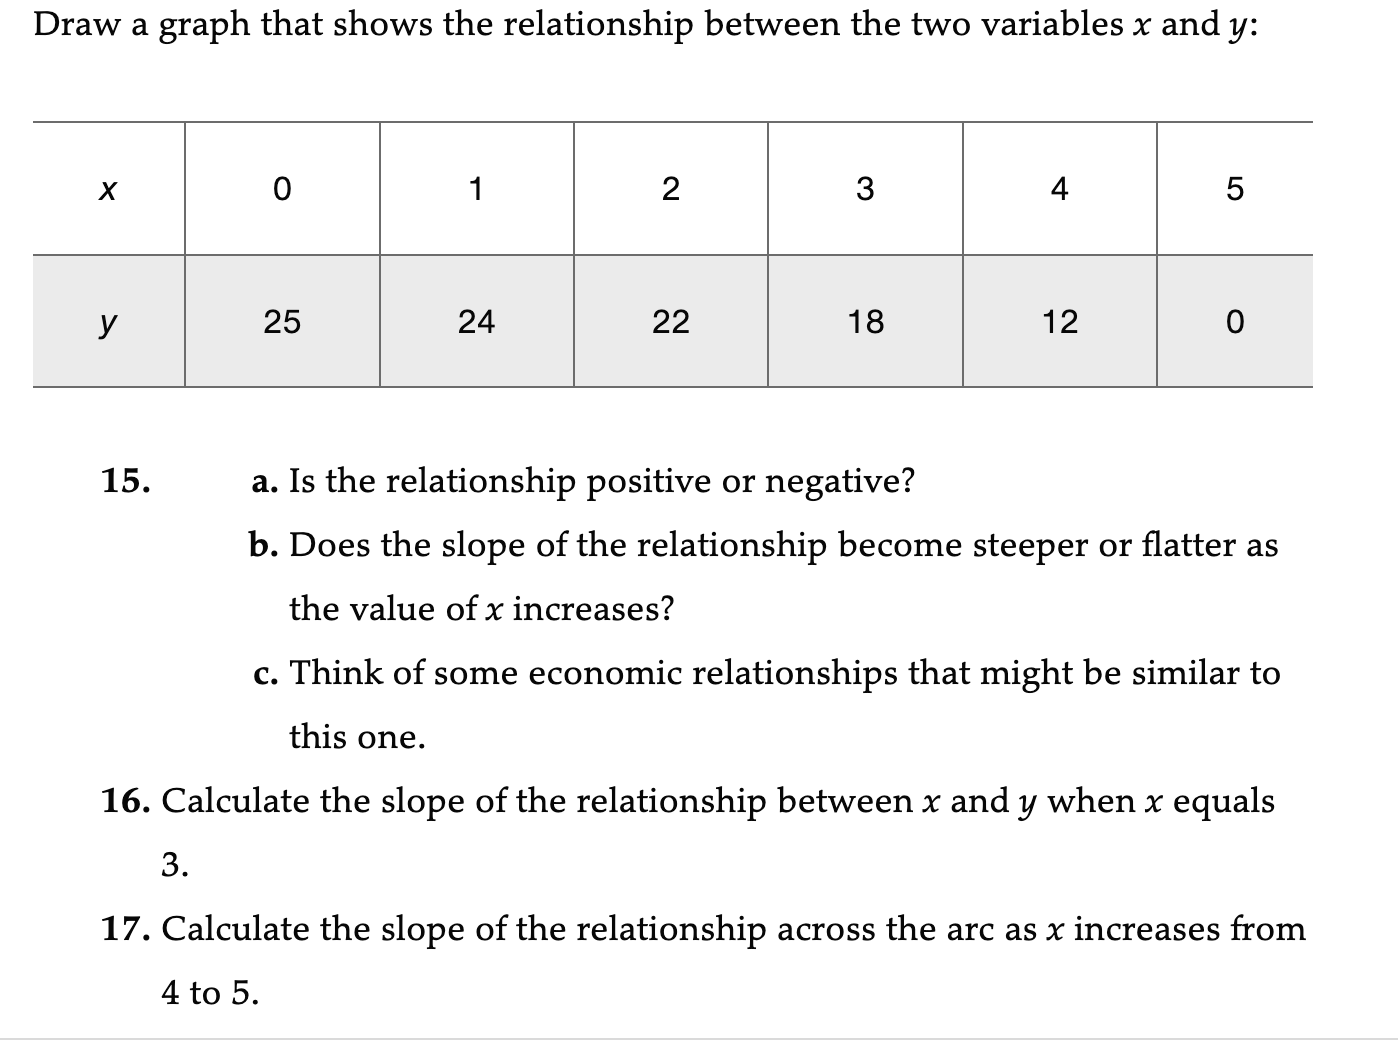
Draw a graph that shows the relationship between the two variables x and y: x 5 y 0 15. a. Is the relationship positive or negative? b. Does the slope of the relationship become steeper or atter as the value of x increases? c. Think of some economic relationships that might be similar to this one. 16. Calculate the slope of the relationship between at and y when 9: equals 3. 17. Calculate the slope of the relationship across the arc as 3: increases from 4to 5
Step by Step Solution
There are 3 Steps involved in it
1 Expert Approved Answer
Step: 1 Unlock

Question Has Been Solved by an Expert!
Get step-by-step solutions from verified subject matter experts
Step: 2 Unlock
Step: 3 Unlock