

Question: draw the cumulative frequency graph to determine if the data is normally distributed or not? Justify your answer. referring to cumulative frequancy graaaaaaaaaaaaph Cumulative
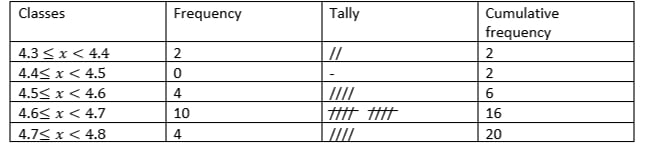
draw the cumulative frequency graph to determine if the data is normally distributed or not? Justify your answer. referring to cumulative frequancy graaaaaaaaaaaaph Cumulative frequency Classes Frequency Tally 4.3 x < 4.4 2 11 2 4.4 x < 4.5 0 2 4.5 x < 4.6 4 IIII 6 4.6 < x < 4.7 10 tttt tttt 16 4.7 < x < 4.8 4 IIII 20
Step by Step Solution
There are 3 Steps involved in it
1 Expert Approved Answer
Step: 1 Unlock

Question Has Been Solved by an Expert!
Get step-by-step solutions from verified subject matter experts
Step: 2 Unlock
Step: 3 Unlock