

Question: Draw the data flow diagram for the below: Below is the sample data flow diagram The experimental setup for this experiment is as follows: A
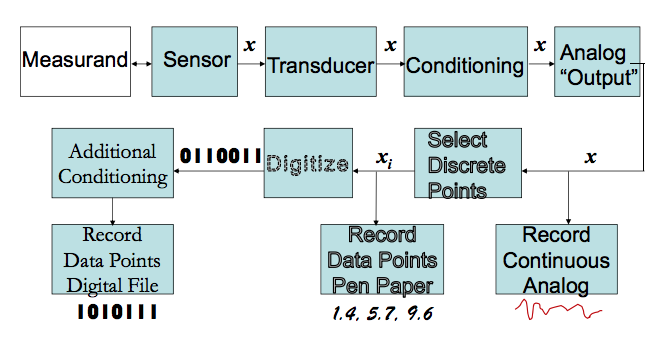
Draw the data flow diagram for the below:
Below is the sample data flow diagram
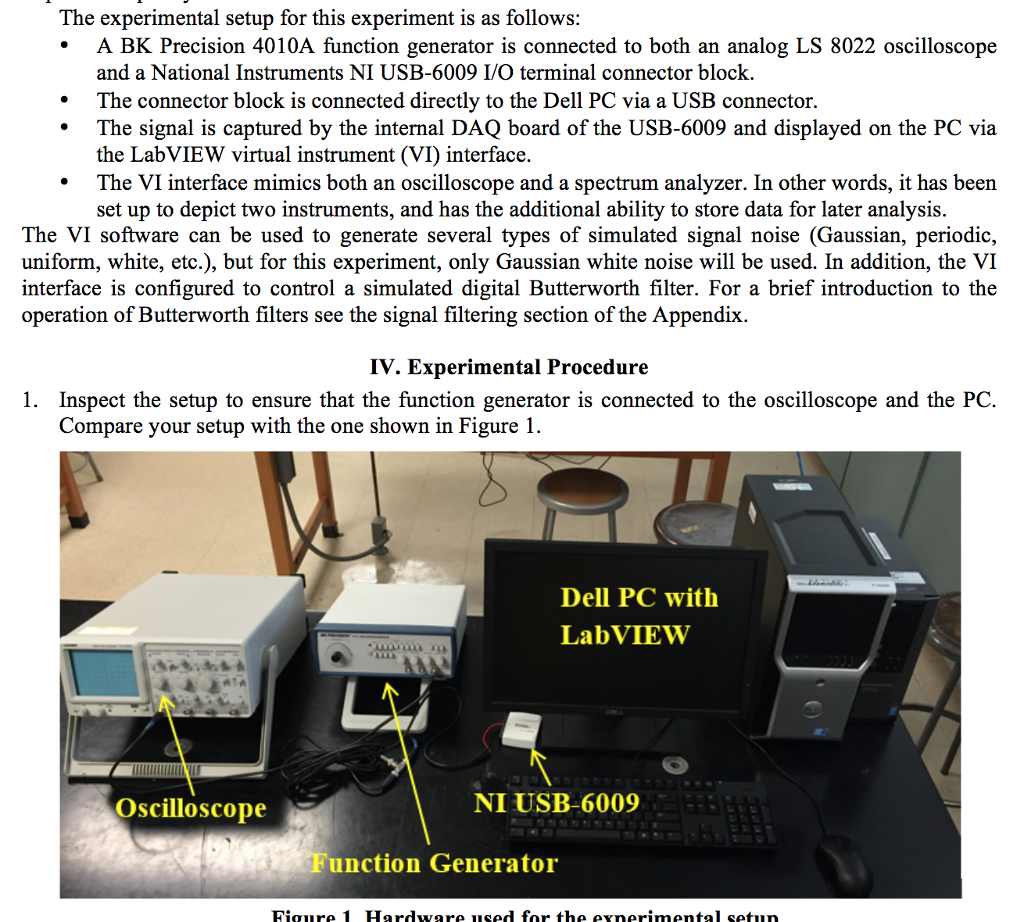
The experimental setup for this experiment is as follows: A BK Precision 4010A function generator is connected to both an analog LS 8022 oscilloscope and a National Instruments NI USB-6009 I/O terminal connector block. .The connector block is connected directly to the Dell PC via a USB connector. The signal is captured by the internal DAQ board of the USB-6009 and displayed on the PC via the LabVIEW virtual instrument (VI) interface. .The VI interface mimics both an oscilloscope and a spectrum analyzer. In other words, it has been set up to depict two instruments, and has the additional ability to store data for later analysis. The VI software can be used to generate several types of simulated signal noise (Gaussian, periodic, uniform, white, etc.), but for this experiment, only Gaussian white noise will be used. In addition, the VI interface is configured to control a simulated digital Butterworth filter. For a brief introduction to the operation of Butterworth filters see the signal filtering section of the Appendix. IV. Experimental Procedure 1. Inspect the setup to ensure that the function generator is connected to the oscilloscope and the PC. ompare your setup with the one shown in Figure Dell PC with LabVIEW Oscilloscope NI USB-6009 Function Generator The experimental setup for this experiment is as follows: A BK Precision 4010A function generator is connected to both an analog LS 8022 oscilloscope and a National Instruments NI USB-6009 I/O terminal connector block. .The connector block is connected directly to the Dell PC via a USB connector. The signal is captured by the internal DAQ board of the USB-6009 and displayed on the PC via the LabVIEW virtual instrument (VI) interface. .The VI interface mimics both an oscilloscope and a spectrum analyzer. In other words, it has been set up to depict two instruments, and has the additional ability to store data for later analysis. The VI software can be used to generate several types of simulated signal noise (Gaussian, periodic, uniform, white, etc.), but for this experiment, only Gaussian white noise will be used. In addition, the VI interface is configured to control a simulated digital Butterworth filter. For a brief introduction to the operation of Butterworth filters see the signal filtering section of the Appendix. IV. Experimental Procedure 1. Inspect the setup to ensure that the function generator is connected to the oscilloscope and the PC. ompare your setup with the one shown in Figure Dell PC with LabVIEW Oscilloscope NI USB-6009 Function Generator
Step by Step Solution
There are 3 Steps involved in it

Get step-by-step solutions from verified subject matter experts