

Question: Draw the Gantt chart and calculate average waiting time using Round Robin scheduler. The time quantum is 3. Use the following table. Use the following

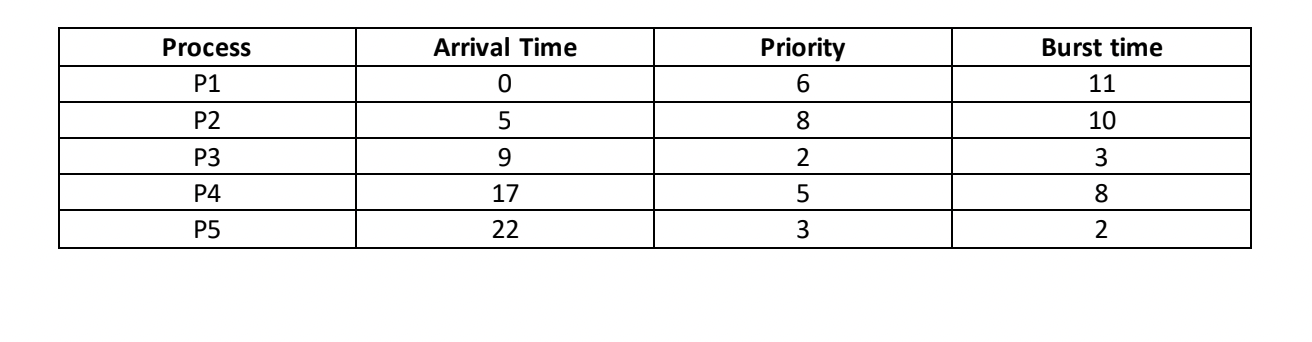
Draw the Gantt chart and calculate average waiting time using Round Robin scheduler. The time quantum is 3. Use the following table. Use the following table. 6 Arrival Time Priority Burst time Process P1 P2 0 11 5 10 P3 9 WUN000 3 17 8 P4 P5 22 2
Step by Step Solution
There are 3 Steps involved in it
1 Expert Approved Answer
Step: 1 Unlock

Question Has Been Solved by an Expert!
Get step-by-step solutions from verified subject matter experts
Step: 2 Unlock
Step: 3 Unlock