

Question: Draw the least squares regression line and write a linear equation that best fits the data in the table shown below. Compute also the
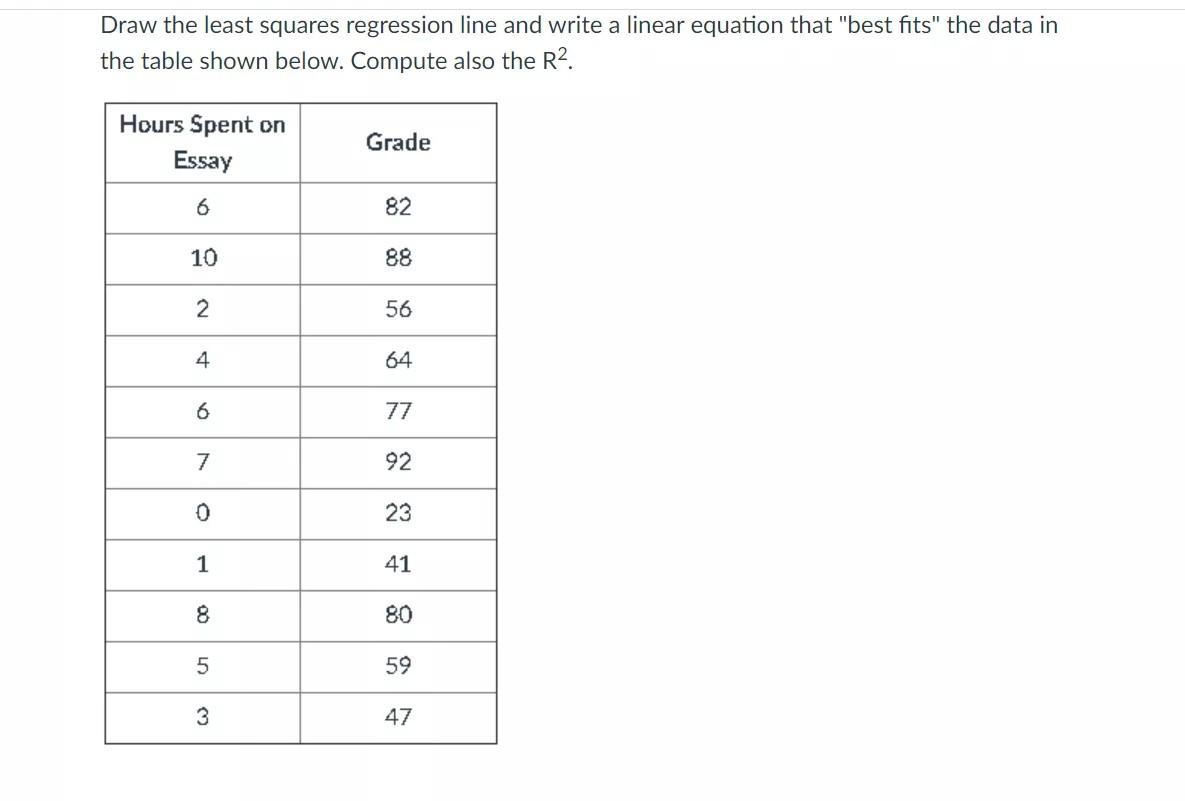
Draw the least squares regression line and write a linear equation that "best fits" the data in the table shown below. Compute also the R. Hours Spent on Grade Essay 6 82 10 88 2 56 4 64 6 77 7 92 0 23 1 41 8 80 5 59 3 47
Step by Step Solution
★★★★★
3.46 Rating (146 Votes )
There are 3 Steps involved in it
1 Expert Approved Answer
Step: 1 Unlock

Question Has Been Solved by an Expert!
Get step-by-step solutions from verified subject matter experts
Step: 2 Unlock
Step: 3 Unlock