

Question: DROP DOWN LIST: 1. how they have changed over a period of time/how they compare to one another/how each stock in the index is performing
DROP DOWN LIST:
1. how they have changed over a period of time/how they compare to one another/how each stock in the index is performing
2.s&p 500 asdaq omx yse euronext yse index asdaq-100
3.s&p 500 asdaq-100 yse index asdaq omx yse euronext\djia
4. nyse index\djia asdaq omx yse euronext\s&p 500 asdaq-100
5. nasdaq-100 yse euronext yses index asdcaq omx\s&p 500\djia
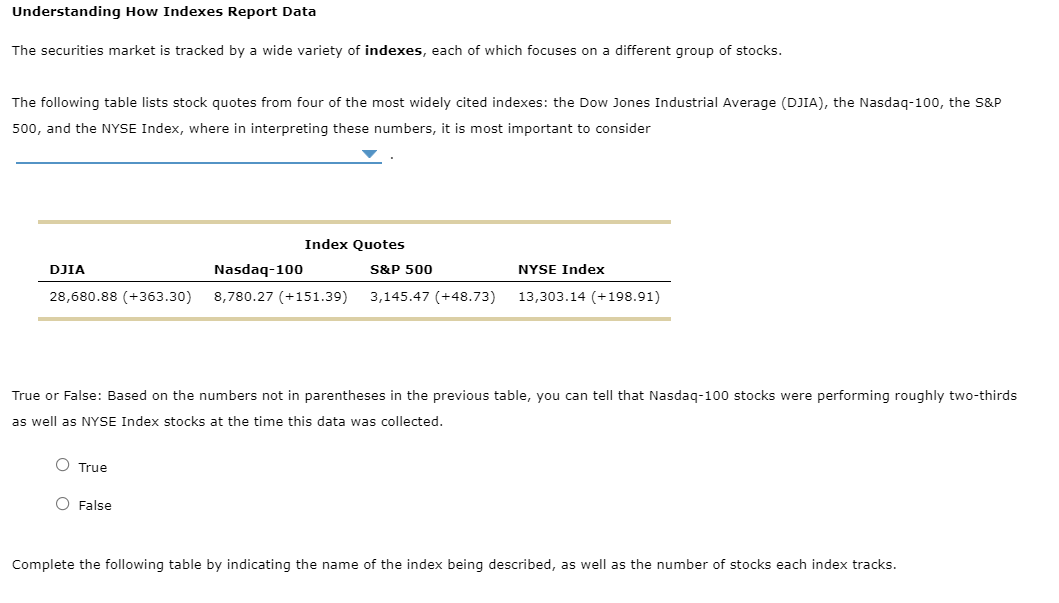
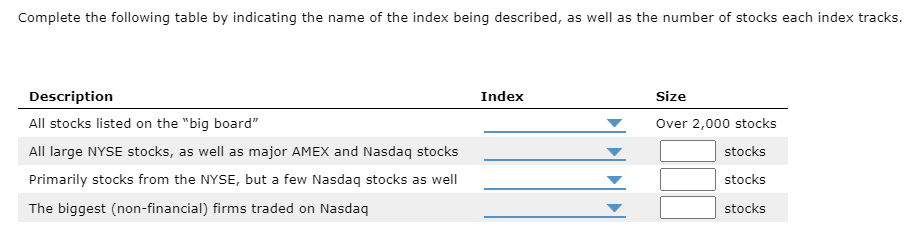
Understanding How Indexes Report Data The securities market is tracked by a wide variety of indexes, each of which focuses on a different group of stocks. The following table lists stock quotes from four of the most widely cited indexes: the Dow Jones Industrial Average (DJIA), the Nasdaq-100, the S&P 500, and the NYSE Index, where in interpreting these numbers, it is most important to consider Index Quotes DJIA S&P 500 NYSE Index Nasdaq-100 8,780.27 (+151.39) 28,680.88 (+363.30) 3,145.47 (+48.73) 13,303.14 (+198.91) True or False: Based on the numbers not in parentheses in the previous table, you can tell that Nasdaq-100 stocks were performing roughly two-thirds as well as NYSE Index stocks at the time this data was collected. O True O False Complete the following table by indicating the name of the index being described, as well as the number of stocks each index tracks. Complete the following table by indicating the name of the index being described, as well as the number of stocks each index tracks. Index Description All stocks listed on the "big board" All large NYSE stocks, as well as major AMEX and Nasdaq stocks Primarily stocks from the NYSE, but a few Nasdaq stocks as well The biggest (non-financial) firms traded on Nasdaq Size Over 2,000 stocks stocks stocks stocks
Step by Step Solution
There are 3 Steps involved in it

Get step-by-step solutions from verified subject matter experts