

Question: Dynamic Phantom: How can I plot the position of the dynamic phantom vs. time (not velocity vs time)? What are the peak and valley values
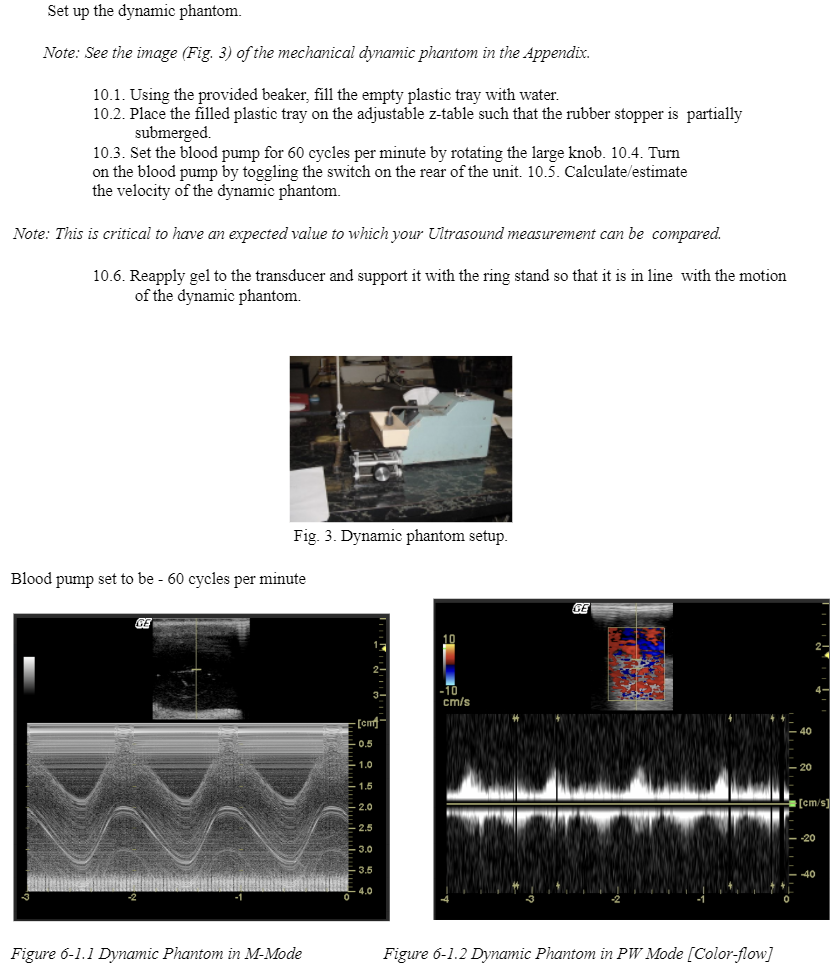
Set up the dynamic phantom. Note: See the image (Fig. 3) of the mechanical dynamic phantom in the Appendix. 10.1. Using the provided beaker, fill the empty plastic tray with water. 10.2. Place the filled plastic tray on the adjustable z-table such that the rubber stopper is partially submerged. 10.3. Set the blood pump for 60 cycles per minute by rotating the large knob. 10.4. Turn on the blood pump by toggling the switch on the rear of the unit. 10.5. Calculate/estimate the velocity of the dynamic phantom. Note: This is critical to have an expected value to which your Ultrasound measurement can be compared. 10.6. Reapply gel to the transducer and support it with the ring stand so that it is in line with the motion of the dynamic phantom. Fig. 3. Dynamic phantom setup. Blood pump set to be - 60 cycles per minute CE Figure 6-1.1 Dynamic Phantom in M-Mode 2- 3- -10 cm/s [cm 0.5 1.0 1.5 2.0 2.5 -3.0 3.5 4.0 GE Figure 6-1.2 Dynamic Phantom in PW Mode [Color-flow] 40 20 [cm/s] -20 -40
Step by Step Solution
There are 3 Steps involved in it

Get step-by-step solutions from verified subject matter experts