

Question: E O REGRESSION AND CORRELATION Computing the sample correlation... Kelly v V For major league baseball teams, is there a relationship between player payrolls and
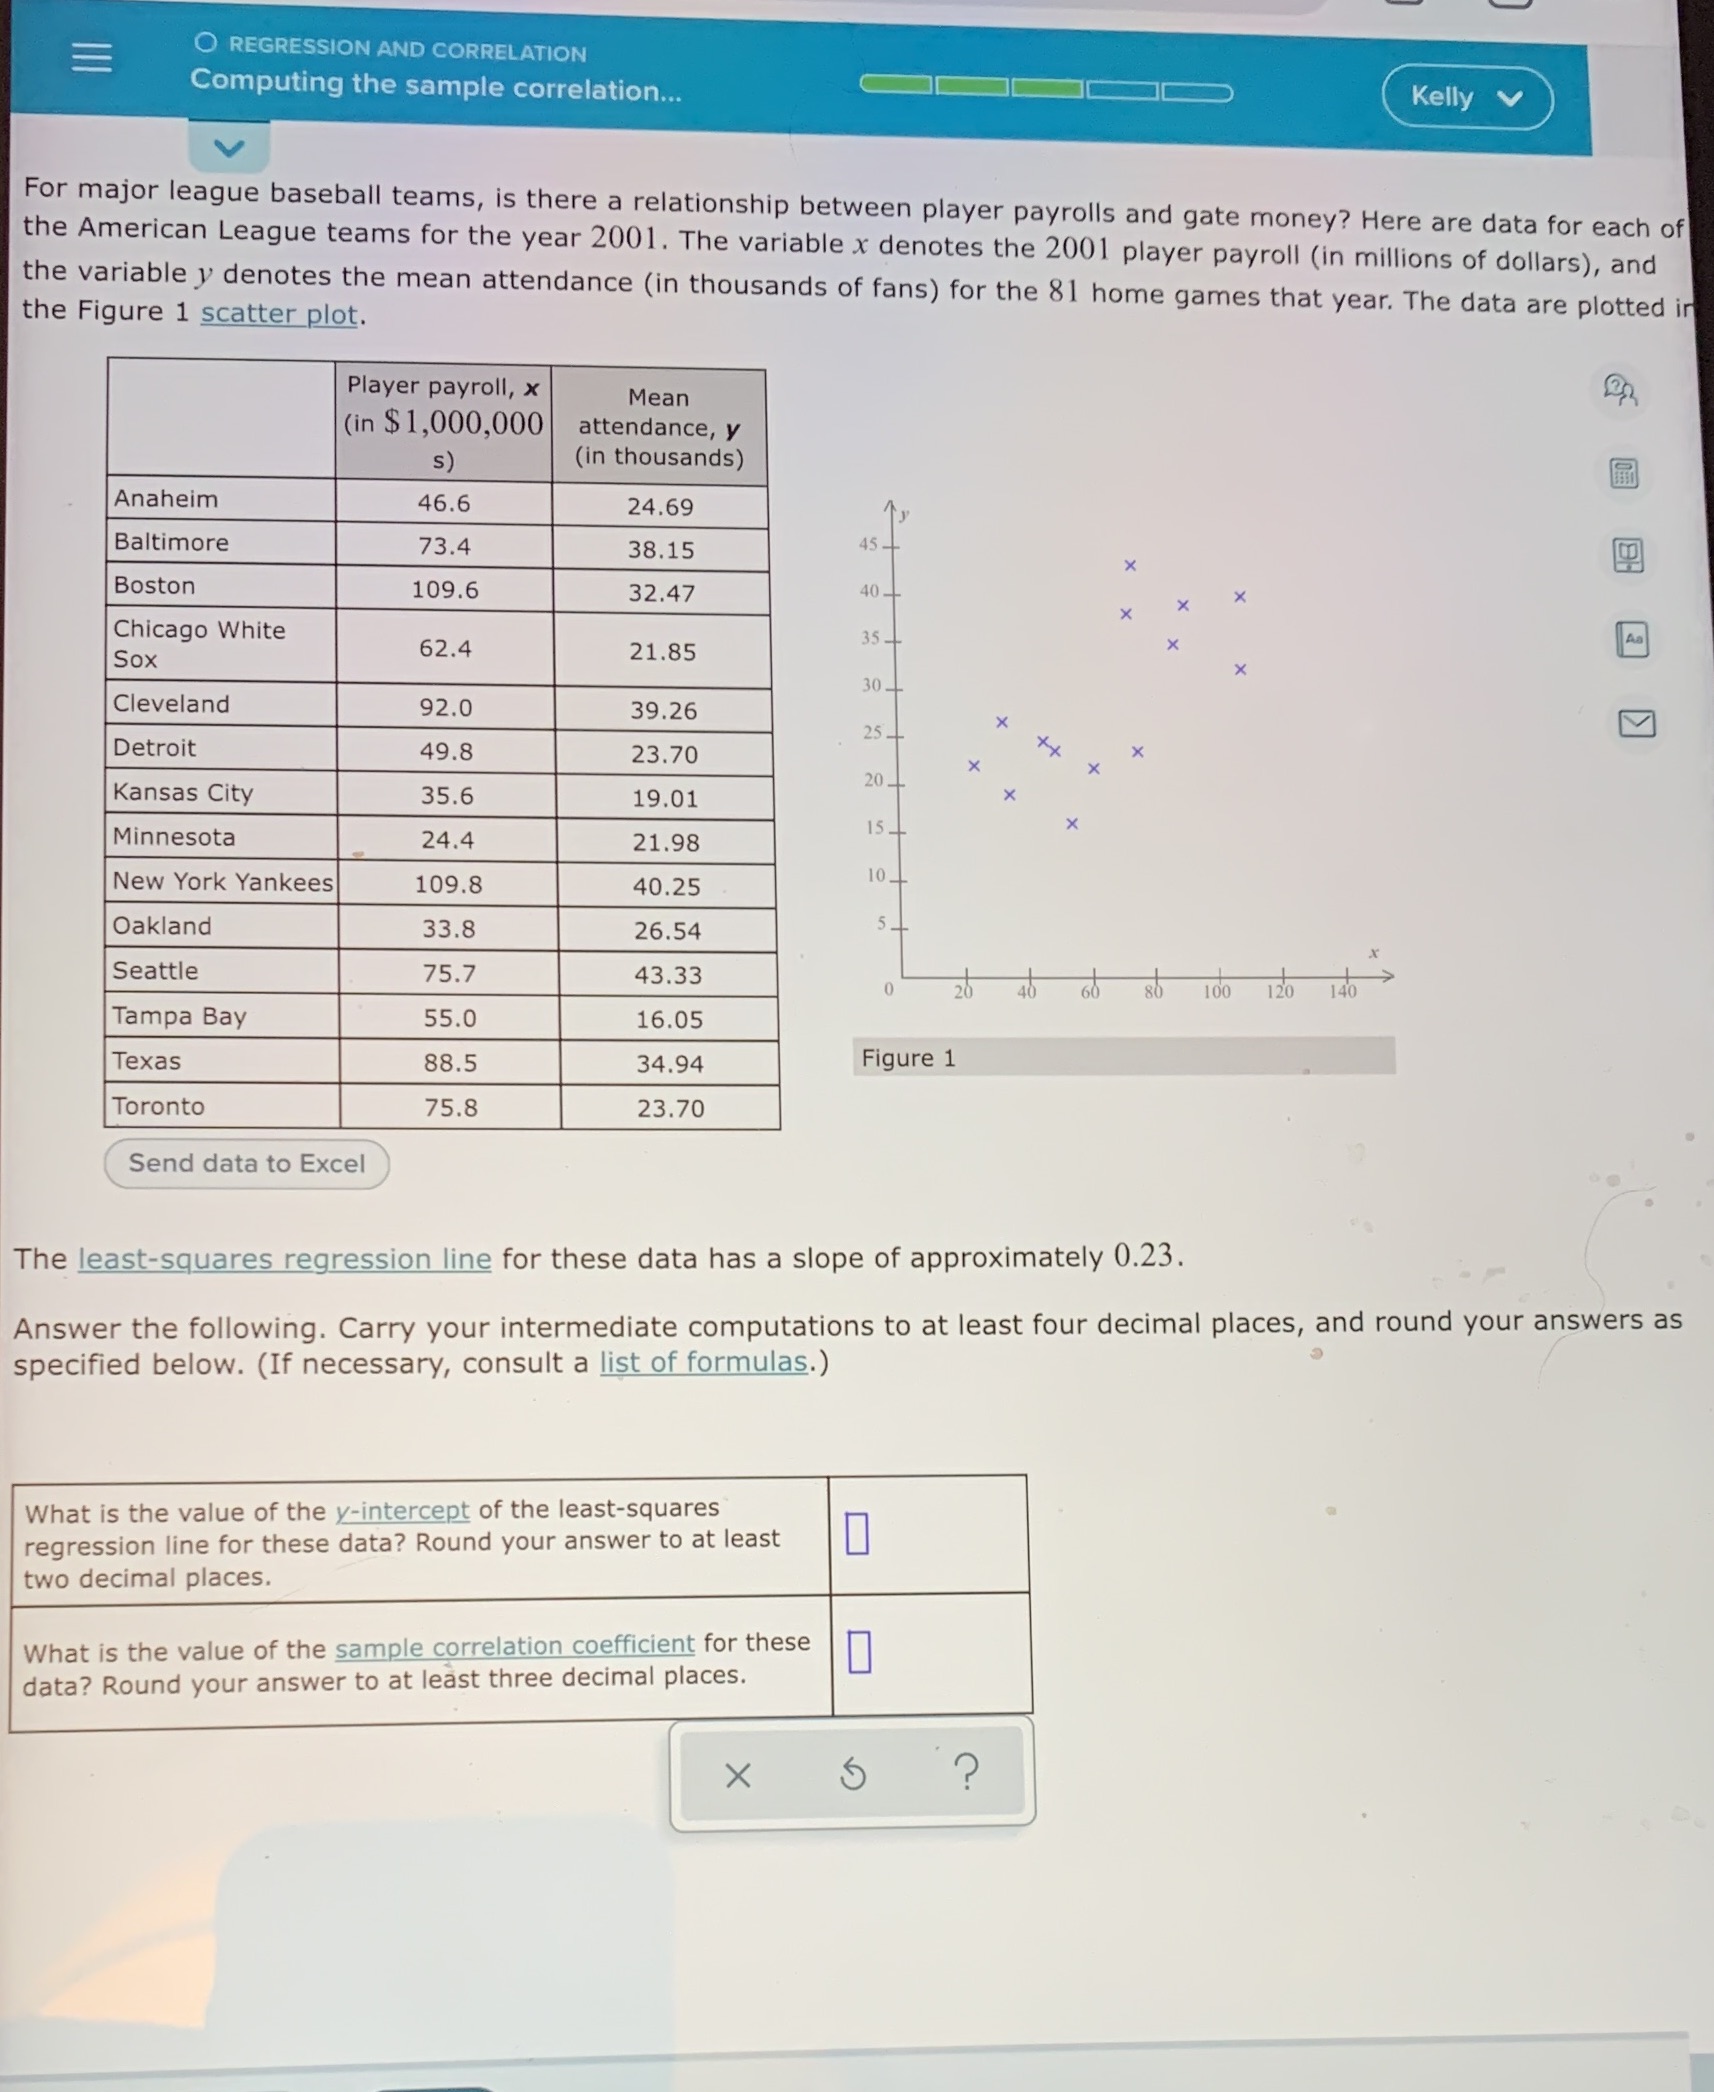
E O REGRESSION AND CORRELATION Computing the sample correlation... Kelly v V For major league baseball teams, is there a relationship between player payrolls and gate money? Here are data for each of the American League teams for the year 2001. The variable x denotes the 2001 player payroll (in millions of dollars), and the variable y denotes the mean attendance (in thousands of fans) for the 81 home games that year. The data are plotted in the Figure 1 scatter plot. Player payroll, x Mean (in $1,000,000 attendance, y s) (in thousands) Anaheim 46.6 24.69 Baltimore 73.4 38.15 45- X Boston 109.6 32.47 40 - X X Chicago White 35 _ Y 62.4 Sox 21.85 X 30 Cleveland 92.0 39.26 X 25. Detroit 49.8 23.70 7% X X 20 _ Kansas City 35.6 19.01 15 _ X Minnesota 24.4 21.98 New York Yankees 109.8 40.25 10_ Oakland 33.8 26.54 Seattle 75. 43.33 20 40 60 80 100 120 140 Tampa Bay 55.0 16.05 Texas 88.5 34.94 Figure 1 Toronto 75.8 23.70 Send data to Excel The least-squares regression line for these data has a slope of approximately 0.23. Answer the following. Carry your intermediate computations to at least four decimal places, and round your answers as specified below. (If necessary, consult a list of formulas.) What is the value of the y-intercept of the least-squares regression line for these data? Round your answer to at least two decimal places. What is the value of the sample correlation coefficient for these data? Round your answer to at least three decimal places. X 5
Step by Step Solution
There are 3 Steps involved in it

Get step-by-step solutions from verified subject matter experts