

Read the 2 pages below that explain how the intermediary flows (in the A technology matrix)...
Fantastic news! We've Found the answer you've been seeking!
Question:
Transcribed Image Text:
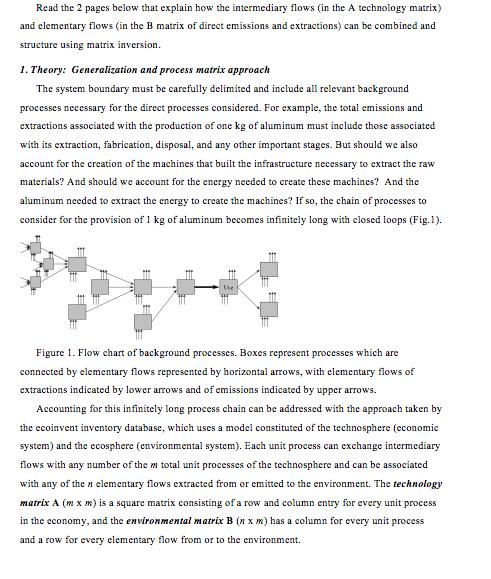
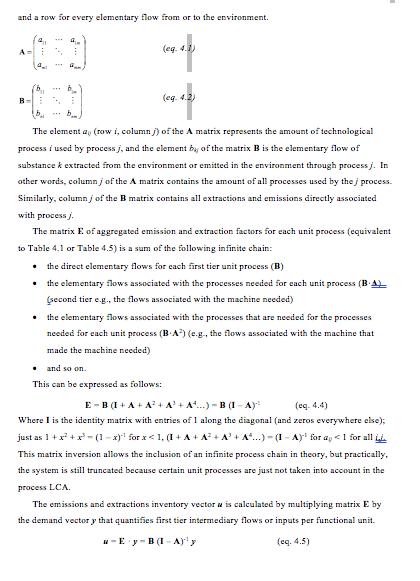
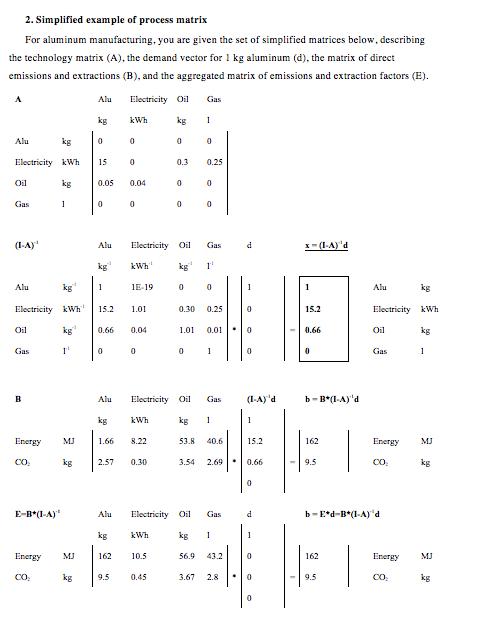
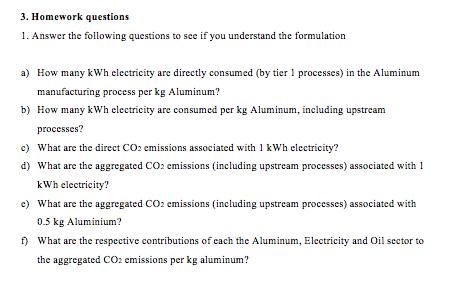
Read the 2 pages below that explain how the intermediary flows (in the A technology matrix) and elementary flows (in the B matrix of direct emissions and extractions) can be combined and structure using matrix inversion. 1. Theory: Generalization and process matrix approach The system boundary must be carefully delimited and include all relevant background processes necessary for the direct processes considered. For example, the total emissions and extractions associated with the production of one kg of aluminum must include those associated with its extraction, fabrication, disposal, and any other important stages. But should we also account for the creation of the machines that built the infrastructure necessary to extract the raw materials? And should we account for the energy needed to create these machines? And the aluminum needed to extract the energy to create the machines? If so, the chain of processes to consider for the provision of 1 kg of aluminum becomes infinitely long with closed loops (Fig.1). Spaget Figure 1. Flow chart of background processes. Boxes represent processes which are connected by elementary flows represented by horizontal arrows, with elementary flows of extractions indicated by lower arrows and of emissions indicated by upper arrows. Accounting for this infinitely long process chain can be addressed with the approach taken by the ecoinvent inventory database, which uses a model constituted of the technosphere (economic system) and the ecosphere (environmental system). Each unit process can exchange intermediary flows with any number of the m total unit processes of the technosphere and can be associated with any of the elementary flows extracted from or emitted to the environment. The technology matrix A (m x m) is a square matrix consisting of a row and column entry for every unit process in the economy, and the environmental matrix B (n x m) has a column for every unit process and a row for every elementary flow from or to the environment. Use and a row for every elementary flow from or to the environment. A B 1 4 (b E bai a 1 G b (eg. 4. (eg. 4.2) The element a, (row i, columnj) of the A matrix represents the amount of technological process i used by process j, and the element by, of the matrix B is the elementary flow of substance k extracted from the environment or emitted in the environment through processj. In other words, column j of the A matrix contains the amount of all processes used by the process. Similarly, column / of the B matrix contains all extractions and emissions directly associated with process. The matrix E of aggregated emis on and extraction factors for each unit process (equivalent to Table 4.1 or Table 4.5) is a sum of the following infinite chain: • the direct elementary flows for each first tier unit process (B) • the elementary flows associated with the processes needed for each unit process (BA) (second tier e.g., the flows associated with the machine needed) . the elementary flows associated with the processes that are needed for the processes needed for each unit process (BA) (e.g., the flows associated with the machine that made the machine needed) and so on. This can be expressed as follows: E B (1+A+A²+A+A...) B (1-A) (eq.4.4) Where I is the identity matrix with entries of 1 along the diagonal (and zeros everywhere else); just as 1 + x²+x-(1-x) for x < 1, (I + A+ A²+ A²+A¹...)-(1-) for a 1 for all This matrix inversion allows the inclusion of an infinite process chain in theory, but practically. the system is still truncated because certain unit processes are just not taken into account in the process LCA. The emissions and extractions inventory vector u is calculated by multiplying matrix E by the demand vector y that quantifies first tier intermediary flows or inputs per functional unit. (eq. 4.5) u-Ey-B(I-A)¹ y 2. Simplified example of process matrix For aluminum manufacturing, you are given the set of simplified matrices below, describing the technology matrix (A), the demand vector for 1 kg aluminum (d), the matrix of direct emissions and extractions (B), and the aggregated matrix of emissions and extraction factors (E). Electricity Oil A Alu kg kWh kg 0 0 Electricity kWh 15 0 0.3 0.25 SEB kg 0.05 0.04 0 0 0 Oil Gas (I-A)¹ Alu kg Electricity kWh Oil Gas B Energy CO₂ 1 E-B*(1-A)* 1¹ CO₂ MJ kg Energy MJ Alu kg Alu kg 1 15.2 0.66 0 kg 1.66 kWh 1E-19 162 1.01 9.5 0.04 0 Electricity Oil Gas 1² kWh 2.57 0.30 8.22 Alu Electricity Oil kg kWh kg 1 0 10.5 0 0.45 0 0.30 Gas 1.01 0 0 0 0 0 0.25 0.01 1 Gas kg 1 53.8 40.6 3.54 2.69 d 1 0 0 0 (I-A) 'd 1 15.2 0.66 0 d 1 0 Alu Electricity Oil Gas kg === 56.9 43.2 3.67 2.8 0 x=(1-A)'d 0 1 15.2 0.66 0 b-B*(1-A) 'd 162 9.5 Alu kg Electricity kWh 162 9.5 Oil Gas Energy CO₂ b-Ed-B*(1-A)'d Energy CO₂ kg 1 MJ kg MJ kg 3. Homework questions 1. Answer the following questions to see if you understand the formulation a) How many kWh electricity are directly consumed (by tier 1 processes) in the Aluminum manufacturing process per kg Aluminum? b) How many kWh electricity are consumed per kg Aluminum, including upstream processes? c) What are the direct CO2 emissions associated with 1 kWh electricity? d) What are the aggregated CO2 emissions (including upstream processes) associated with 1 kWh electricity? e) What are the aggregated CO2 emissions (including upstream processes) associated with 0.5 kg Aluminium? f) What are the respective contributions of each the Aluminum, Electricity and Oil sector to the aggregated CO2 emissions per kg aluminum? Read the 2 pages below that explain how the intermediary flows (in the A technology matrix) and elementary flows (in the B matrix of direct emissions and extractions) can be combined and structure using matrix inversion. 1. Theory: Generalization and process matrix approach The system boundary must be carefully delimited and include all relevant background processes necessary for the direct processes considered. For example, the total emissions and extractions associated with the production of one kg of aluminum must include those associated with its extraction, fabrication, disposal, and any other important stages. But should we also account for the creation of the machines that built the infrastructure necessary to extract the raw materials? And should we account for the energy needed to create these machines? And the aluminum needed to extract the energy to create the machines? If so, the chain of processes to consider for the provision of 1 kg of aluminum becomes infinitely long with closed loops (Fig.1). Spaget Figure 1. Flow chart of background processes. Boxes represent processes which are connected by elementary flows represented by horizontal arrows, with elementary flows of extractions indicated by lower arrows and of emissions indicated by upper arrows. Accounting for this infinitely long process chain can be addressed with the approach taken by the ecoinvent inventory database, which uses a model constituted of the technosphere (economic system) and the ecosphere (environmental system). Each unit process can exchange intermediary flows with any number of the m total unit processes of the technosphere and can be associated with any of the elementary flows extracted from or emitted to the environment. The technology matrix A (m x m) is a square matrix consisting of a row and column entry for every unit process in the economy, and the environmental matrix B (n x m) has a column for every unit process and a row for every elementary flow from or to the environment. Use and a row for every elementary flow from or to the environment. A B 1 4 (b E bai a 1 G b (eg. 4. (eg. 4.2) The element a, (row i, columnj) of the A matrix represents the amount of technological process i used by process j, and the element by, of the matrix B is the elementary flow of substance k extracted from the environment or emitted in the environment through processj. In other words, column j of the A matrix contains the amount of all processes used by the process. Similarly, column / of the B matrix contains all extractions and emissions directly associated with process. The matrix E of aggregated emis on and extraction factors for each unit process (equivalent to Table 4.1 or Table 4.5) is a sum of the following infinite chain: • the direct elementary flows for each first tier unit process (B) • the elementary flows associated with the processes needed for each unit process (BA) (second tier e.g., the flows associated with the machine needed) . the elementary flows associated with the processes that are needed for the processes needed for each unit process (BA) (e.g., the flows associated with the machine that made the machine needed) and so on. This can be expressed as follows: E B (1+A+A²+A+A...) B (1-A) (eq.4.4) Where I is the identity matrix with entries of 1 along the diagonal (and zeros everywhere else); just as 1 + x²+x-(1-x) for x < 1, (I + A+ A²+ A²+A¹...)-(1-) for a 1 for all This matrix inversion allows the inclusion of an infinite process chain in theory, but practically. the system is still truncated because certain unit processes are just not taken into account in the process LCA. The emissions and extractions inventory vector u is calculated by multiplying matrix E by the demand vector y that quantifies first tier intermediary flows or inputs per functional unit. (eq. 4.5) u-Ey-B(I-A)¹ y 2. Simplified example of process matrix For aluminum manufacturing, you are given the set of simplified matrices below, describing the technology matrix (A), the demand vector for 1 kg aluminum (d), the matrix of direct emissions and extractions (B), and the aggregated matrix of emissions and extraction factors (E). Electricity Oil A Alu kg kWh kg 0 0 Electricity kWh 15 0 0.3 0.25 SEB kg 0.05 0.04 0 0 0 Oil Gas (I-A)¹ Alu kg Electricity kWh Oil Gas B Energy CO₂ 1 E-B*(1-A)* 1¹ CO₂ MJ kg Energy MJ Alu kg Alu kg 1 15.2 0.66 0 kg 1.66 kWh 1E-19 162 1.01 9.5 0.04 0 Electricity Oil Gas 1² kWh 2.57 0.30 8.22 Alu Electricity Oil kg kWh kg 1 0 10.5 0 0.45 0 0.30 Gas 1.01 0 0 0 0 0 0.25 0.01 1 Gas kg 1 53.8 40.6 3.54 2.69 d 1 0 0 0 (I-A) 'd 1 15.2 0.66 0 d 1 0 Alu Electricity Oil Gas kg === 56.9 43.2 3.67 2.8 0 x=(1-A)'d 0 1 15.2 0.66 0 b-B*(1-A) 'd 162 9.5 Alu kg Electricity kWh 162 9.5 Oil Gas Energy CO₂ b-Ed-B*(1-A)'d Energy CO₂ kg 1 MJ kg MJ kg 3. Homework questions 1. Answer the following questions to see if you understand the formulation a) How many kWh electricity are directly consumed (by tier 1 processes) in the Aluminum manufacturing process per kg Aluminum? b) How many kWh electricity are consumed per kg Aluminum, including upstream processes? c) What are the direct CO2 emissions associated with 1 kWh electricity? d) What are the aggregated CO2 emissions (including upstream processes) associated with 1 kWh electricity? e) What are the aggregated CO2 emissions (including upstream processes) associated with 0.5 kg Aluminium? f) What are the respective contributions of each the Aluminum, Electricity and Oil sector to the aggregated CO2 emissions per kg aluminum?
Expert Answer:
Answer rating: 100% (QA)
To answer the homework questions we must refer to the matrices provided in the simplified example of the process matrix and apply the logic from the t... View the full answer

Related Book For 

Posted Date:
Students also viewed these mechanical engineering questions
-
In January, Dieker Company requisitions raw materials for production as follows: Job 1 $900, Job 2 $1,200, Job 3 $700 and general factory use $600. Prepare a summary journal entry to record raw...
-
Costs and Production Data Actual Standard Raw materials unit cost $2.10 $1.90 Raw materials units 11,300 10,700 Direct labor payroll $168,5720 $166,770 Direct labor hours worked 14,800 15,300...
-
Sierra Company manufactures woven blankets and accounts for product costs using process costing. Data below are for one of its processing departments. The following information is available regarding...
-
Determine the largest force P that can be exerted at the jaws of the punch without exceeding a stress of 16 ksi on section m-n of the frame.
-
1. SK Telecom is attempting to distant itself from which South Korean cultural value? What indicators of this value are identified in this case study? What other artifacts of this cultural value...
-
Atkins Advertising Agency began business on January 2, 2010. The transactions entered into by Atkins during its first month of operations are as follows: a. Acquired its articles of incorporation...
-
The scale reading on the rotameter shown in Fig. P8.133 (also see Fig. 8.44) is directly proportional to the volumetric flowrate. With a scale reading of 2.6 the water bubbles up approximately 3 in....
-
Jimmy Jones operates Jimmys Cricket Farm in Eatonton, Georgia. Jimmys raises about 18 million crickets a month. Most are sold to pet stores at $ 12.90 for a box of 1,000 crickets. Pet stores sell the...
-
1. Analyze and explain the theoretical concepts related to the balance of payments of a country. A country has exports of $20 billion, imports of $25 billion, net transfers from abroad of $1 billion,...
-
Kate, Bob and Tim work in your team. Each has a separate work role but must liaise with each other to coordinate the workflow and to complete overall team tasks.There is a problem between Kate and...
-
A gas station opened up on a stretch of highway where there are no other gas stations close by. It is more likely to be able to set higher prices because a). The demand for its product is more...
-
Give three interpretations of the pure expectations theory.
-
What are the types of risks associated with investing in bonds and how do these two risks affect the pure expectations theory?
-
What is the cash flow for an auto loan-backed security?
-
a. What is the difference between a normal yield curve and steep yield curve? b. What is meant by a humped yield curve?
-
What are the components of the cash flow for an SBA-backed security?
-
Explain the principles behind virtual memory management in modern operating systems, including concepts such as demand paging, page replacement algorithms, and address translation techniques.
-
An educational researcher devised a wooden toy assembly project to test learning in 6-year-olds. The time in seconds to assemble the project was noted, and the toy was disassembled out of the childs...
-
For the data in Exercise 17.45, and using total nonrenewable energy production as the dependent variable, perform conventional multiple regression and stepwise regression analyses on the data, then...
-
Use an appropriate confidence interval in reaching a conclusion regarding the problem situation and null hypothesis for Exercise 10.31. In exercise Following maintenance and calibration, an extrusion...
-
Item C of the Springdale Shopping Survey, introduced at the end of Chapter 2, describes variables 79 of the survey. These variables represent the general attitude respondents have toward each of the...
-
You are setting up a chatbot agency to service marketing, sales and customer services teams. Discuss the advantages and disadvantages of setting up the business as a sole trader or company and the...
-
Principles for Responsible Management Education (PRME) is a not-for-profit entity. It engages business schools to ensure they provide future leaders with the skills needed to balance economic and...
-
Entities are expected to perform in environmental, governance and social areas as well as profit (unless a not-for-profit entity). List some key performance indicators applicable to each sphere.

Study smarter with the SolutionInn App