

Question: E) Run chart F) Control chart G) Flowchart OH) Pareto chart 1) Check sheet OJ) Cause-and-effect diagram Missing Off Smeared Loose or Day Time
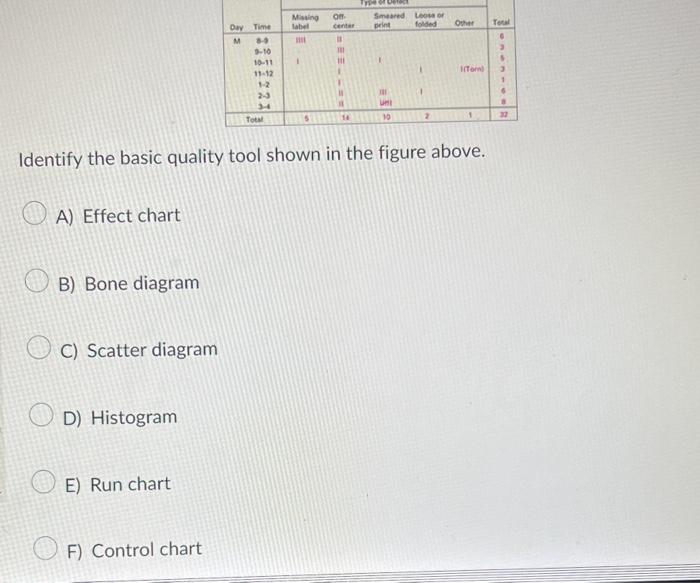
E) Run chart F) Control chart G) Flowchart OH) Pareto chart 1) Check sheet OJ) Cause-and-effect diagram Missing Off Smeared Loose or Day Time label center print folded Other Total M 3-4 9-10 3 10-11 11-12 (Tom) 3 1-2 1 2-3 1 6 34 Uni B Total $ 14 10 2 1 22 Identify the basic quality tool shown in the figure above. A) Effect chart B) Bone diagram C) Scatter diagram D) Histogram E) Run chart F) Control chart
Step by Step Solution
There are 3 Steps involved in it
1 Expert Approved Answer
Step: 1 Unlock

Question Has Been Solved by an Expert!
Get step-by-step solutions from verified subject matter experts
Step: 2 Unlock
Step: 3 Unlock