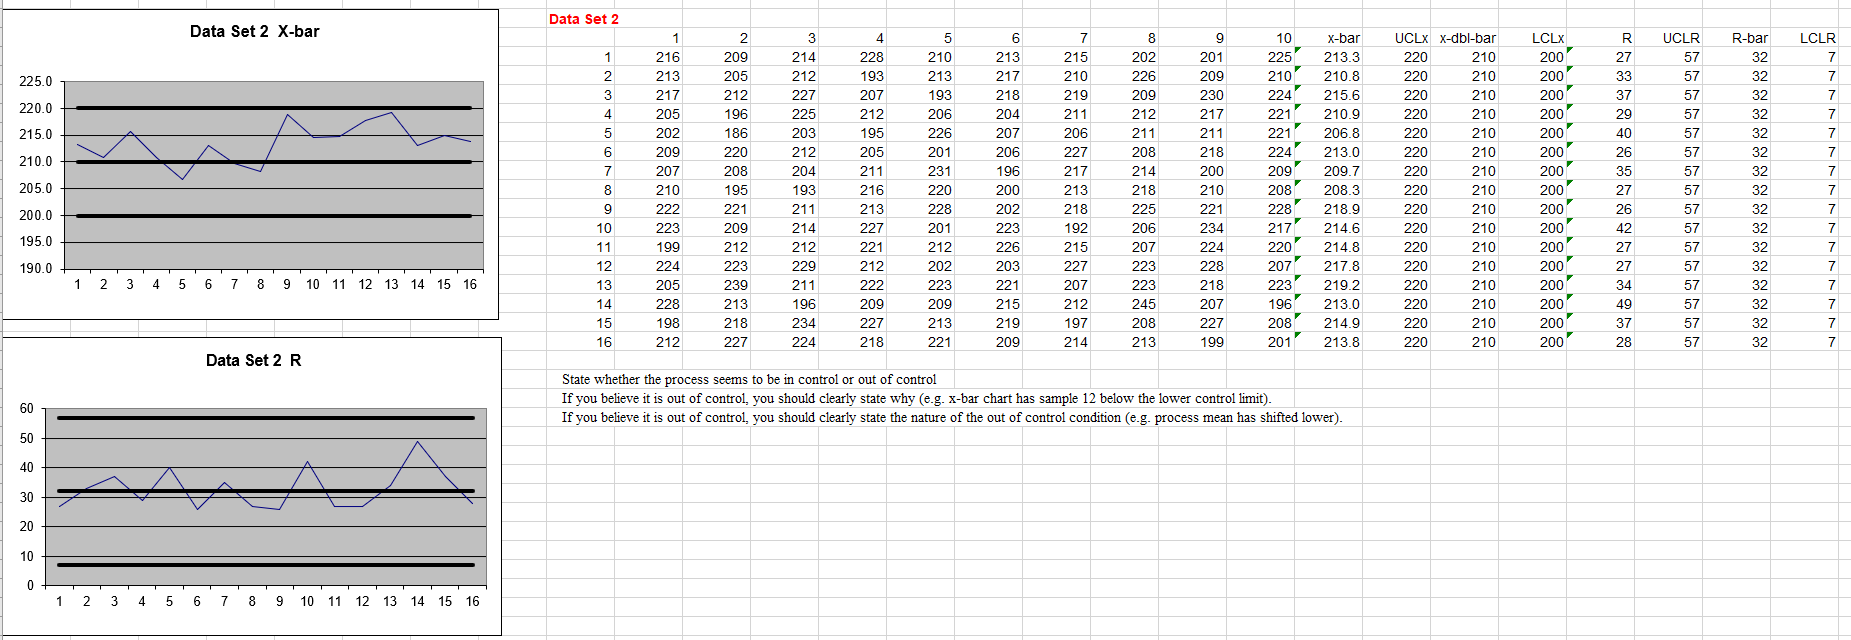
Question: Each data set represents 16 samples of size 10 observations. From each sample, X-bar and R were calculated and then plotted on the appropriate control
Each data set represents 16 samples of size 10 observations. From each sample, X-bar and R were calculated and then plotted on the appropriate control chart. You are to evaluate each data set for out of control conditions. Specifically, you should:
1) State whether the process seems to be in control or out of control
2) If you believe it is out of control, you should clearly state why (e.g. x-bar chart has sample 12 below the lower control limit).
3) If you believe it is out of control, you should clearly state the nature of the out of control condition (e.g. process mean has shifted lower).

Data Set 2 Data Set 2 X-bar 10 225 210 7 215 210 219 211 206 LCLR 7 7 7 225.0 224 220.0 221 7 7 215.0 227 210.0 7 1 1 216 213 217 205 202 209 207 210 222 223 199 224 205 228 198 212 205.0 2 209 205 212 196 186 220 208 195 221 209 212 223 239 213 218 227 1 2 2 3 4 5 6 7 8 9 10 11 12 13 14 15 16 3 214 212 227 225 203 212 204 193 211 214 212 229 211 196 234 224 4 228 193 207 212 195 205 211 216 213 227 221 212 222 209 227 218 LCLX 2007 2001 200 200 200 200 2007 2007 5 210 213 193 206 226 201 231 220 228 201 212 202 223 209 213 221 6 213 217 218 204 207 206 196 200 202 223 226 203 221 215 219 209 8 202 226 209 212 211 208 214 218 225 206 207 223 223 245 208 213 9 201 209 230 217 211 218 200 210 221 234 224 228 218 207 227 199 X-bar 213.3 210.8 215.6 210.9 206.8 213.0 209.7 208.3 218.9 214.6 214.8 217.8 219.2 213.0 214.9 213.8 UCLX X-dbl-bar 220 210 220 210 220 210 220 210 220 210 220 210 220 210 220 210 220 210 220 210 220 210 220 210 220 210 220 210 220 210 220 210 R 27 33 37 29 40 26 35 27 26 42 27 27 34 217 213 218 192 215 227 207 212 197 214 7 7 UCLR 57 57 57 57 57 57 57 57 57 57 57 57 57 57 57 57 221 224 209 208 228 217 220 207 223 196 208 201 R-bar 32 32 32 32 32 32 32 32 32 32 32 32 32 32 32 32 200.0 200 195.0 2007 2007 190.0 2007 7 7 7 7 7 7 7 7 1 2 3 4 5 6 7 8 9 10 11 12 13 14 15 16 200 2007 2007 49 37 28 200 Data Set 2 R State whether the process seems to be in control or out of control If you believe it is out of control, you should clearly state why (e.g. x-bar chart has sample 12 below the lower control limit). If you believe it is out of control, you should clearly state the nature of the out of control condition (e.g. process mean has shifted lower). 60 50 40 A 30 20 10 0 1 2 3 4 5 6 7 8 9 10 11 10 11 12 13 14 15 16