

Question: Each Student will analyze their corporate selection for 2 0 2 1 and perform the calculations for each ratio in table [ [ ,
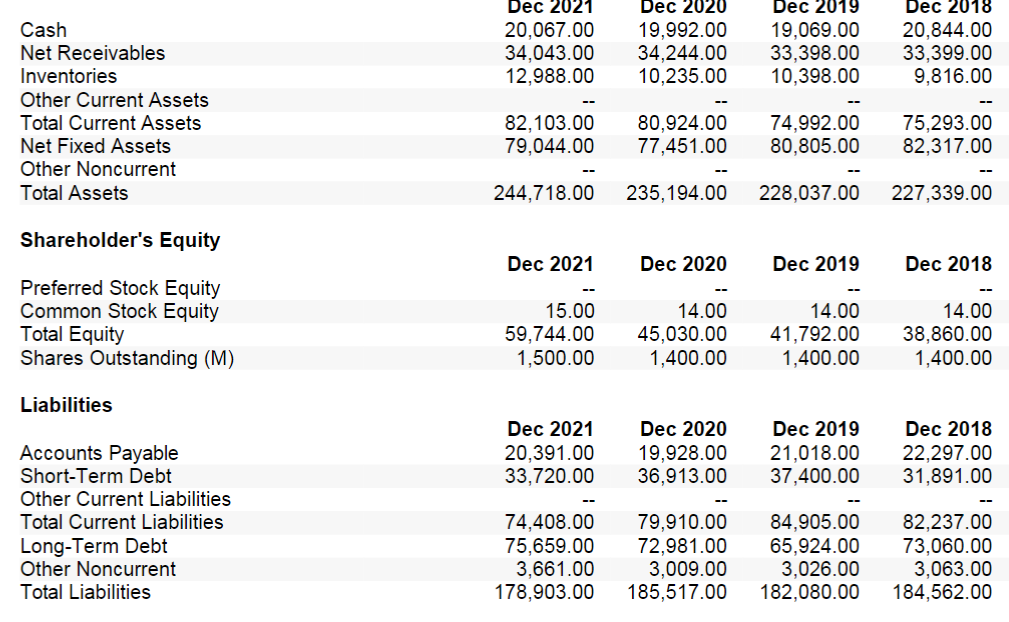
Each Student will analyze their corporate selection for and perform the calculations for each ratio intableDec Dec Dec Dec RevenueCost of Goods Sold,Gross Profit,Gross Profit Margin,SG&A Expense,Depreciation and Amortization,Operating Income,Operating Margin,Nonoperating Income,Nonoperating Expenses,Income Before Taxes,Income Taxes,Net Income After Taxes,Continuing Operations,Discontinued Operations,Total Operations,Total Net Income,Net Profit Margin,Diluted EPS from Continuing Operations,Diluted EPS from Total Operations,Diluted EPS from Total Net Income,tablecsecCashNet Receivables,InventoriesOther Current Assets,Total Current Assets,Net Fixed Assets,Other Noncurrent,Total Assets,Shareholders EquityDec Dec Dec Dec Preferred Stock Equity,Common Stock Equity,Total Equity,Shares Outstanding MLiabilitiesDec Dec Dec Dec Accounts Payable,ShortTerm Debt,Other Current Liabilities,Total Current Liabilities,LongTerm Debt,Other Noncurrent,Total Liabilities,
the above table. Please show all of your calculations when creating the ratios. In addition, each student will
then summarize their analytical conclusions for each ratio category in the following analytical worksheet to Find the Liquidity
Management
Debt Management
Profitability
Market Performance
Working Capital
AR Turnover
Times Interest Earned
Gross Margin
Earnings Per Share
Current Ratio
Inventory Turnover
DebtEquity
Net Profit Margin
Price Earnings
Acid Test
Asset Turnover
Equity Multiplier
ROE
Dividend Yield
![the calculations for each ratio in\table[[,Dec 2021,Dec 2020,Dec 2019,Dec 2018],[Revenue,127,004.00,122,485.00,137,237.00,147,049.00],[Cost of Goods](https://s3.amazonaws.com/si.experts.images/answers/2024/06/6663eff20e832_5226663eff208e24.jpg)
Step by Step Solution
There are 3 Steps involved in it
1 Expert Approved Answer
Step: 1 Unlock

Question Has Been Solved by an Expert!
Get step-by-step solutions from verified subject matter experts
Step: 2 Unlock
Step: 3 Unlock