Question: Earn value analysis. For your reports you must utilize The project cost and staying us information presented earlier in the assignment to demonstrate your knowledge
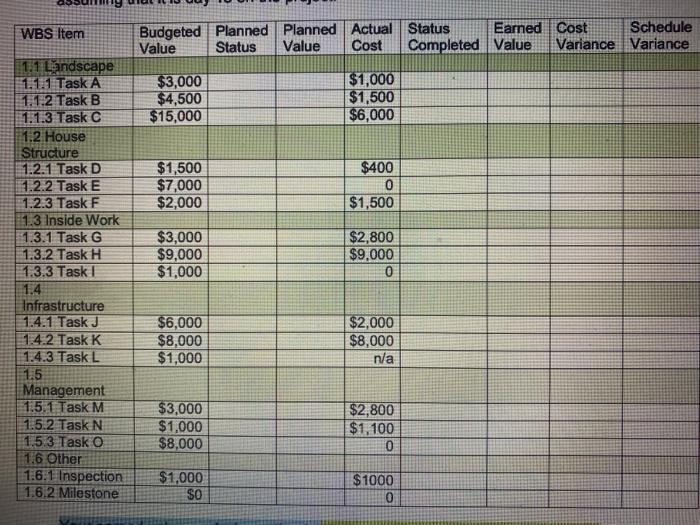
Earn value analysis. For your reports you must utilize The project cost and staying us information presented earlier in the assignment to demonstrate your knowledge Of earned value analysis. The easiest way to complete this assignment is to copy the following table into excel and set up excel formula so you will need to calculate each required value. earn value analysis table complete the missing information for the project assume that it's day 15 on the project.
Your earn value analysis section is also to include the following information. Plan value, actual cost and earn value totals a project as a whole. Total cost and set schedule variance for the project as a whole. Ensure that you lost all your formula so using the calculations and provide interpretation and guidance as to what the cost of the schedule variations mean to the project. (please show steps so I undertand)
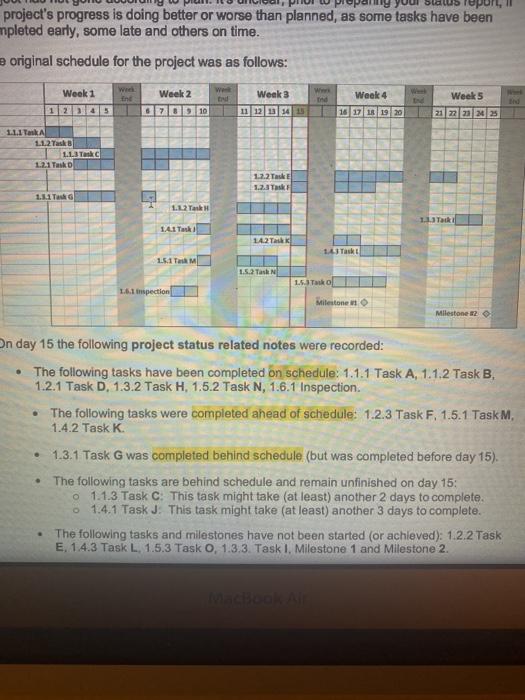
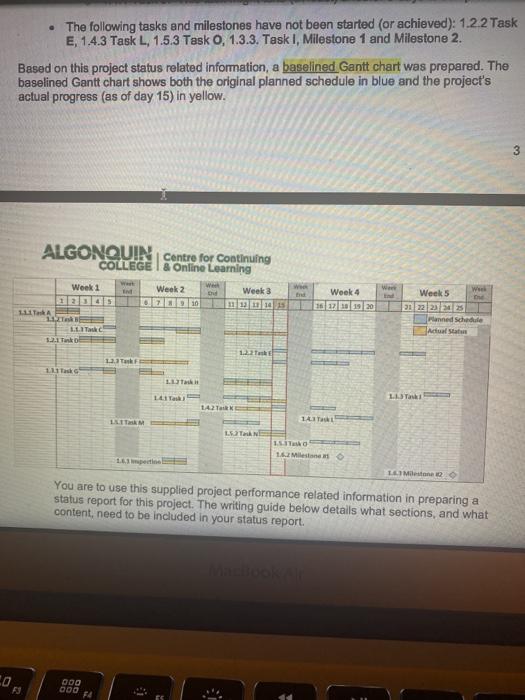
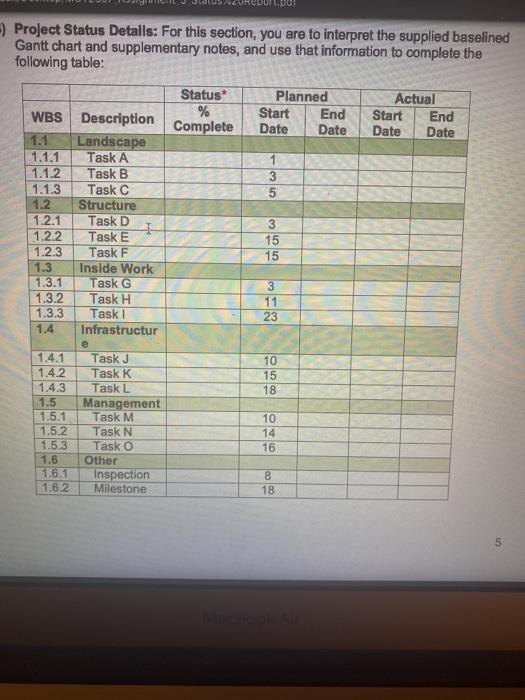
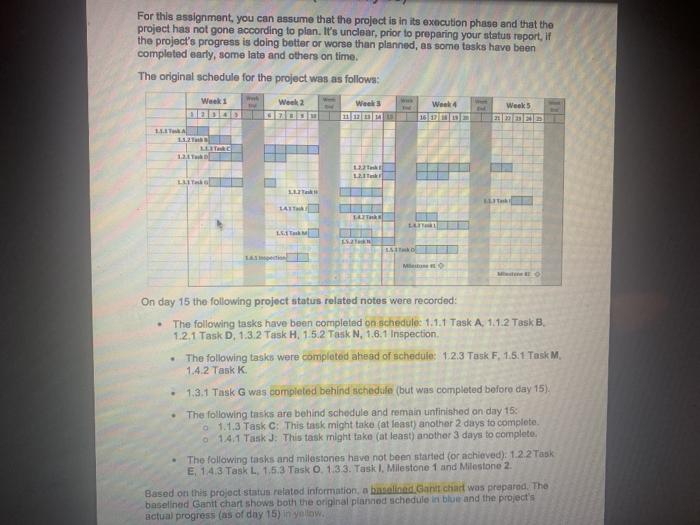
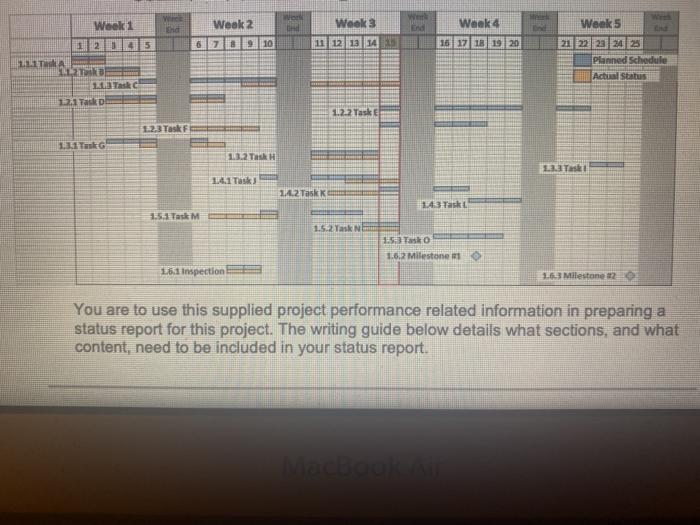
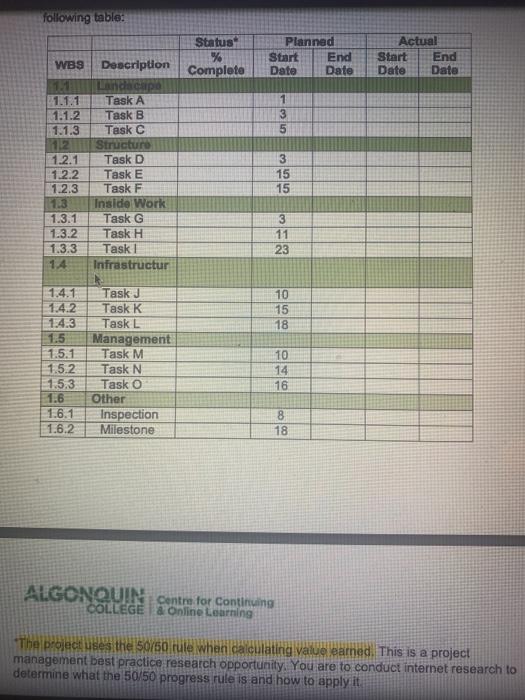
WBS Item Budgeted Planned Planned Actual Status Earned Cost Schedule Value Status Value Cost Completed Value Variance Variance $3,000 $4,500 $15,000 $1,000 $1,500 | $6,000 $1,500 $7,000 $2,000 $400 0 $1,500 1.1 Landscape 1.1.1 Task A 1.1.2 Task B 1.1.3 Task C 1.2 House Structure 1.2.1 Task D 11.2.2 Task E 1.2.3 Task F 1.3 Inside Work 1.3.1 Task G 1.3.2 Task H 1.3.3 Task 1.4 Infrastructure 1.4.1 Task J 1.4.2 Task K 1.4.3 Task L $3,000 $9,000 $1,000 $2,800 $9,000 0 $6,000 $8,000 $1,000 $2,000 $8,000 n/a 1.5 Management 1.5.1 Task M 1.5.2 Task N 1.5.3 Task o 1.6 Other 1.6.1 Inspection 1.6.2 Milestone $3,000 $1,000 $8,000 $2,800 $1,100 0 $1,000 SO $1000 0 Popary report project's progress is doing better or worse than planned, as some tasks have been npleted early, some late and others on time. original schedule for the project was as follows: Week 4 Week 1 1 2 3 4 5 we Ini Week 2 Solo 10 Ww Week 3 11 12 13 14 15 Week 5 21 22 23 24 25 16 17 18 19 20 1.1.1 TMA 1.1.2 TaskB L.13 Task 1.21 Task 1.2.2 TE 1.2.3 Task 1. Tako 1.12 Tank 1.TR 1.4.1 Task 142 Task 143Take 1.5.1 TM 1.5.2 Task 1.6.1 inspection 1.5.30 ditestone 1 Milestone 2 On day 15 the following project status related notes were recorded: The following tasks have been completed on schedule: 1.1.1 Task A, 1.1.2 Task B. 1.2.1 Task D, 1.3.2 Task H, 1.5.2 Task N, 1.6.1 Inspection. The following tasks were completed ahead of schedule: 1.2.3 Task F. 1.5.1 Task M, 1.4.2 Task K. 1.3.1 Task G was completed behind schedule (but was completed before day 15). The following tasks are behind schedule and remain unfinished on day 15: o 1.1.3 Task C: This task might take (at least) another 2 days to complete. 1.4.1 Task J: This task might take (at least) another 3 days to complete. The following tasks and milestones have not been started (or achieved): 1.2.2 Task E. 1.4.3 Task L. 1.5.3 Task o, 1.3.3. Task 1, Milestone 1 and Milestone 2. The following tasks and milestones have not been started (or achieved): 1.22 Task E, 1.4.3 Task L, 1.5.3 Task 0, 1.3.3. Task 1, Milestone 1 and Milestone 2. Based on this project status related information, a baselined Gantt chart was prepared. The baselined Gantt chart shows both the original planned schedule in blue and the project's actual progress (as of day 15) in yellow. 3 ALGONQUIN continuing w Week 4 16 17 18 19 20 COLLEGE I & Online Learning Week 1 Week 2 We Week 3 200 Q10 In 1903 111 Tak 11 1. Tack 1.2. Tako 1.2.2 Tuk We Weeks 21 22 23 24 25 Planned Schedule Adult 11 14 Task 1.1.3 Tak 14 Tak M 14. LT 1. 1. Miles 1.6.1 pine 1 Milestone 12 You are to use this supplied project performance related information in preparing a status report for this project. The writing guide below details what sections, and what content, need to be included in your status report. 000 14 -) Project Status Details: For this section, you are to interpret the supplied baselined Gantt chart and supplementary notes, and use that information to complete the following table: Planned Start End Date Date Actual Start End Date Date 3 5 3 15 15 Status* WBS Description % Complete 1.1 Landscape 1.1.1 Task A 1.1.2 Task B 1.1.3 Task C 1.2 Structure 1.2.1 Task D 1.2.2 Task E 1.2.3 Task F 1.3 Inside Work 1.3.1 Task G 1.3.2 Task H 1.3.3 Task 1 1.4 Infrastructur e 1.4.1 Task J 1.4.2 Task K 1.4.3 Task L 1.5 Management 1.5.1 Task M 1.5.2 Task N 1.5.3 Task O 1.6 Other 1.6.1 Inspection 1.6.2 Milestone 3 11 23 10 15 18 10 14 16 8 18 5 For this assignment, you can assume that the project is in its execution phase and that the project has not gone according to plan. It's unclear, prior to preparing your status report, I the project's progress is doing better or worse than planned, as some tasks have been completed early, some late and others on time. The original schedule for the project was as follows: Weeks Week 1 an Week 2 GED Week 4 16.00 Week 5 DED 11.2 TRE 12. LAT TL Tak L. On day 15 the following project status related notes were recorded: The following tasks have been completed on schedule: 1.1.1 Task A 1.1.2 Task B 12.1 Task D, 1.3.2 Task H. 1.5.2 Task N, 1.6.1 Inspection The following tasks were completed ahead of schedule: 1.2.3 Task F, 1.5.1 Task M. 1.4.2 Task K 1.3.1 Task G was completed behind schedule (but was completed before day 15). The following tasks are behind schedule and remain unfinished on day 15. 1.1.3 Task C: This task might take (at least another 2 days to complete a 1.41 Task J: This task might take (at least) another 3 days to completo. The following tasks and milestones have not been started (or achieved): 1.2.2 Task E 14 3 Task L. 1.5.3 Task 0.13 3. Task Milestone 1 and Milestone 2. Based on this project status related information, a baseline Gantt chart was prepared. The baselined Gantt chart shows both the original planned schedule in blue and the project's actual progress (as of day 15) in yellow Wh Week 3 Week 4 En Week 2 6 7 8 9 10 11 12 13 14 16 17 18 19 20 We Weel 1 125 LITA FILT La Task 12.1 Tako Week 5 21 22 23 24 25 Planned Schedule Actual Status 1.2.2 Task E 1.2.3 Task F 1. Tank 1.3.2 Task ski 134.I Task 12Task 143 Task 15.1 Task M 1.52 Task 1:53 Tako 1.6.2 Milestone 16.1 Inspection 16.3 Milestone 12 You are to use this supplied project performance related information in preparing a status report for this project. The writing guide below details what sections, and what content, need to be included in your status report. NE following table: Status % Completa Planned Start End Date Date Actual Start End Date Date 1 3 5 WBS Description 1.1 Landscape 1.1.1 Task A 1.1.2 Task B 1.1.3 Task C 12 Structura 1.2.1 Task D 1.2.2 Task E 1.2.3 Task F 123 Inside Work 1.3.1 Task G 1.3.2 Task H 1.3.3 Task 1 1.4 Infrastructur 3 15 15 3 11 23 10 15 18 1.4.1 1.4.2 1.4.3 1.5 1.5.1 1.5.2 1.5.3 1.6 1.6.1 1.6.2 Task J Task K Task L Management Task M Task N Task o Other Inspection Milestone 10 14 16 8 18 ALGONQUIN Sunannte Continuing COLLEGE & Online Learning The project uses the 50/50 rule when calculating value earned. This is a project management best practice research opportunity. You are to conduct internet research to determine what the 50/50 progress rule is and how to apply it WBS Item Budgeted Planned Planned Actual Status Earned Cost Schedule Value Status Value Cost Completed Value Variance Variance $3,000 $4,500 $15,000 $1,000 $1,500 | $6,000 $1,500 $7,000 $2,000 $400 0 $1,500 1.1 Landscape 1.1.1 Task A 1.1.2 Task B 1.1.3 Task C 1.2 House Structure 1.2.1 Task D 11.2.2 Task E 1.2.3 Task F 1.3 Inside Work 1.3.1 Task G 1.3.2 Task H 1.3.3 Task 1.4 Infrastructure 1.4.1 Task J 1.4.2 Task K 1.4.3 Task L $3,000 $9,000 $1,000 $2,800 $9,000 0 $6,000 $8,000 $1,000 $2,000 $8,000 n/a 1.5 Management 1.5.1 Task M 1.5.2 Task N 1.5.3 Task o 1.6 Other 1.6.1 Inspection 1.6.2 Milestone $3,000 $1,000 $8,000 $2,800 $1,100 0 $1,000 SO $1000 0 Popary report project's progress is doing better or worse than planned, as some tasks have been npleted early, some late and others on time. original schedule for the project was as follows: Week 4 Week 1 1 2 3 4 5 we Ini Week 2 Solo 10 Ww Week 3 11 12 13 14 15 Week 5 21 22 23 24 25 16 17 18 19 20 1.1.1 TMA 1.1.2 TaskB L.13 Task 1.21 Task 1.2.2 TE 1.2.3 Task 1. Tako 1.12 Tank 1.TR 1.4.1 Task 142 Task 143Take 1.5.1 TM 1.5.2 Task 1.6.1 inspection 1.5.30 ditestone 1 Milestone 2 On day 15 the following project status related notes were recorded: The following tasks have been completed on schedule: 1.1.1 Task A, 1.1.2 Task B. 1.2.1 Task D, 1.3.2 Task H, 1.5.2 Task N, 1.6.1 Inspection. The following tasks were completed ahead of schedule: 1.2.3 Task F. 1.5.1 Task M, 1.4.2 Task K. 1.3.1 Task G was completed behind schedule (but was completed before day 15). The following tasks are behind schedule and remain unfinished on day 15: o 1.1.3 Task C: This task might take (at least) another 2 days to complete. 1.4.1 Task J: This task might take (at least) another 3 days to complete. The following tasks and milestones have not been started (or achieved): 1.2.2 Task E. 1.4.3 Task L. 1.5.3 Task o, 1.3.3. Task 1, Milestone 1 and Milestone 2. The following tasks and milestones have not been started (or achieved): 1.22 Task E, 1.4.3 Task L, 1.5.3 Task 0, 1.3.3. Task 1, Milestone 1 and Milestone 2. Based on this project status related information, a baselined Gantt chart was prepared. The baselined Gantt chart shows both the original planned schedule in blue and the project's actual progress (as of day 15) in yellow. 3 ALGONQUIN continuing w Week 4 16 17 18 19 20 COLLEGE I & Online Learning Week 1 Week 2 We Week 3 200 Q10 In 1903 111 Tak 11 1. Tack 1.2. Tako 1.2.2 Tuk We Weeks 21 22 23 24 25 Planned Schedule Adult 11 14 Task 1.1.3 Tak 14 Tak M 14. LT 1. 1. Miles 1.6.1 pine 1 Milestone 12 You are to use this supplied project performance related information in preparing a status report for this project. The writing guide below details what sections, and what content, need to be included in your status report. 000 14 -) Project Status Details: For this section, you are to interpret the supplied baselined Gantt chart and supplementary notes, and use that information to complete the following table: Planned Start End Date Date Actual Start End Date Date 3 5 3 15 15 Status* WBS Description % Complete 1.1 Landscape 1.1.1 Task A 1.1.2 Task B 1.1.3 Task C 1.2 Structure 1.2.1 Task D 1.2.2 Task E 1.2.3 Task F 1.3 Inside Work 1.3.1 Task G 1.3.2 Task H 1.3.3 Task 1 1.4 Infrastructur e 1.4.1 Task J 1.4.2 Task K 1.4.3 Task L 1.5 Management 1.5.1 Task M 1.5.2 Task N 1.5.3 Task O 1.6 Other 1.6.1 Inspection 1.6.2 Milestone 3 11 23 10 15 18 10 14 16 8 18 5 For this assignment, you can assume that the project is in its execution phase and that the project has not gone according to plan. It's unclear, prior to preparing your status report, I the project's progress is doing better or worse than planned, as some tasks have been completed early, some late and others on time. The original schedule for the project was as follows: Weeks Week 1 an Week 2 GED Week 4 16.00 Week 5 DED 11.2 TRE 12. LAT TL Tak L. On day 15 the following project status related notes were recorded: The following tasks have been completed on schedule: 1.1.1 Task A 1.1.2 Task B 12.1 Task D, 1.3.2 Task H. 1.5.2 Task N, 1.6.1 Inspection The following tasks were completed ahead of schedule: 1.2.3 Task F, 1.5.1 Task M. 1.4.2 Task K 1.3.1 Task G was completed behind schedule (but was completed before day 15). The following tasks are behind schedule and remain unfinished on day 15. 1.1.3 Task C: This task might take (at least another 2 days to complete a 1.41 Task J: This task might take (at least) another 3 days to completo. The following tasks and milestones have not been started (or achieved): 1.2.2 Task E 14 3 Task L. 1.5.3 Task 0.13 3. Task Milestone 1 and Milestone 2. Based on this project status related information, a baseline Gantt chart was prepared. The baselined Gantt chart shows both the original planned schedule in blue and the project's actual progress (as of day 15) in yellow Wh Week 3 Week 4 En Week 2 6 7 8 9 10 11 12 13 14 16 17 18 19 20 We Weel 1 125 LITA FILT La Task 12.1 Tako Week 5 21 22 23 24 25 Planned Schedule Actual Status 1.2.2 Task E 1.2.3 Task F 1. Tank 1.3.2 Task ski 134.I Task 12Task 143 Task 15.1 Task M 1.52 Task 1:53 Tako 1.6.2 Milestone 16.1 Inspection 16.3 Milestone 12 You are to use this supplied project performance related information in preparing a status report for this project. The writing guide below details what sections, and what content, need to be included in your status report. NE following table: Status % Completa Planned Start End Date Date Actual Start End Date Date 1 3 5 WBS Description 1.1 Landscape 1.1.1 Task A 1.1.2 Task B 1.1.3 Task C 12 Structura 1.2.1 Task D 1.2.2 Task E 1.2.3 Task F 123 Inside Work 1.3.1 Task G 1.3.2 Task H 1.3.3 Task 1 1.4 Infrastructur 3 15 15 3 11 23 10 15 18 1.4.1 1.4.2 1.4.3 1.5 1.5.1 1.5.2 1.5.3 1.6 1.6.1 1.6.2 Task J Task K Task L Management Task M Task N Task o Other Inspection Milestone 10 14 16 8 18 ALGONQUIN Sunannte Continuing COLLEGE & Online Learning The project uses the 50/50 rule when calculating value earned. This is a project management best practice research opportunity. You are to conduct internet research to determine what the 50/50 progress rule is and how to apply it