

Question: (a) Make a line graph of the U.S. civilian labor force data. Line Graph A Line Graph B US Civilian Labor Force (2007-2016) US
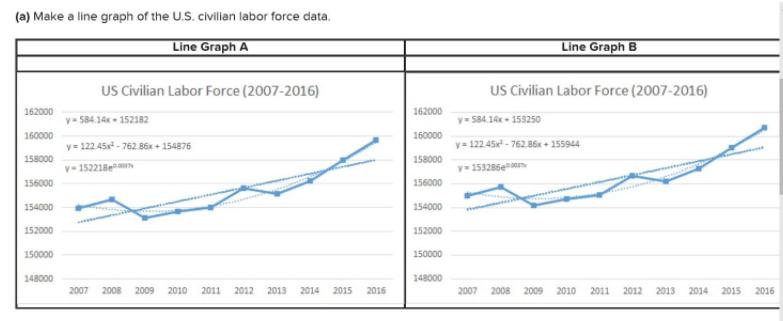
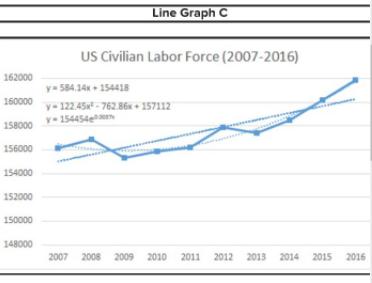
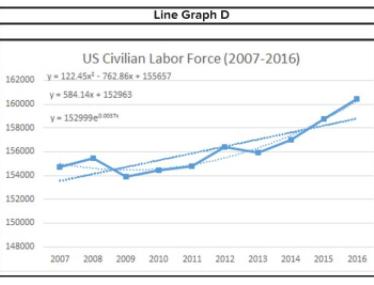
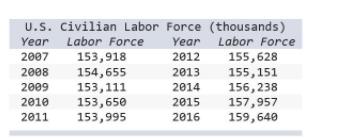
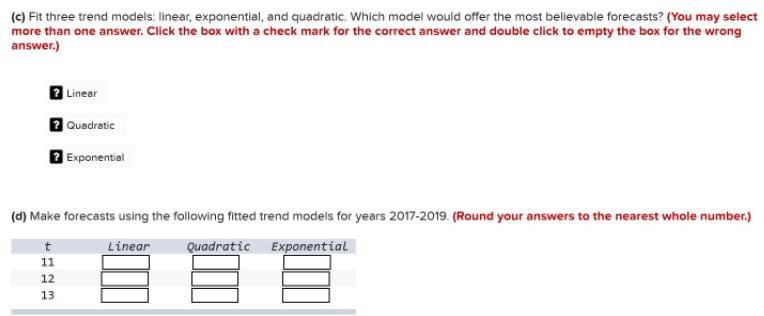
(a) Make a line graph of the U.S. civilian labor force data. Line Graph A Line Graph B US Civilian Labor Force (2007-2016) US Civilian Labor Force (2007-2016) 162000 162000 v- 584.14 - 152182 y- 584.14x - 153250 160000 160000 y = 12245 - 762.86 + 154876 y= 122 45x - 762.86x + 155944 158000 158000 v-152218e y153286e 156000 156000 154000 154000 152000 152000 150000 150000 148000 148000 2007 2008 2009 2010 2011 2012 2013 2014 2015 2016 2007 2008 2009 2010 2011 2012 2013 2014 2015 2016 Line Graph C US Civilian Labor Force (2007-2016) 162000 y 584.14x+ 154418 160000 y- 122.45 - 762.86 + 157112 y- 154454en 158000 156000 154000 152000 150000 148000 2007 2008 2009 2010 2011 2012 2013 2014 2015 2016 Line Graph D US Civilian Labor Force (2007-2016) 162000 y- 12245xl - 762.86x + 155657 y- 584.14- 152963 160000 v- 152999e 158000 156000 154000 152000 150000 148000 2007 2008 2009 2010 2011 2012 2013 2014 2015 2016 U.S. civilian Labor Force (thousands) Year Labor Force Year Labor Force 2007 153,918 2012 155,628 2008 154,655 153,111 153,650 153,995 2013 155,151 156,238 157,957 159,640 2009 2014 2010 2015 2011 2016 (c) Fit three trend models: linear, exponential, and quadratic. Which model would offer the most believable forecasts? (You may select more than one answer. Click the box with a check mark for the correct answer and double click to empty the box for the wrong answer.) Linear Quadratic 2 Exponential (d) Make forecasts using the following fitted trend models for years 2017-2019. (Round your answers to the nearest whole number.) Linear Quadratic Exponential 11 12 13
Step by Step Solution
3.38 Rating (154 Votes )
There are 3 Steps involved in it
To solve this question well go through each part stepbystep c Fit Three Trend Models The task is to determine which model provides the most believable ... View full answer

Get step-by-step solutions from verified subject matter experts