

Question: (a) Plot the data on airplane shipments. U.S. Manufactured General Aviation Shipments, 2009- 2015 Year Qtr 1 Qtr 2 Qtr 3 Qtr 4 Total
![]()
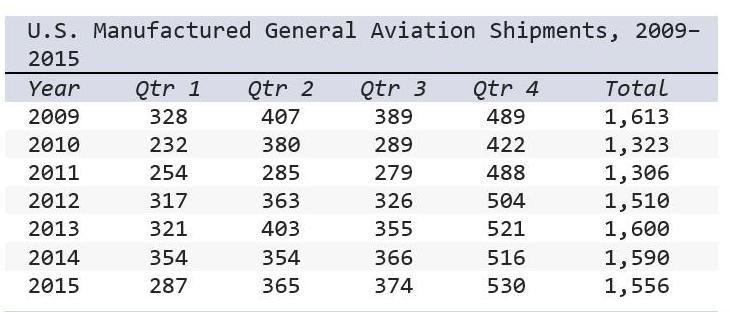
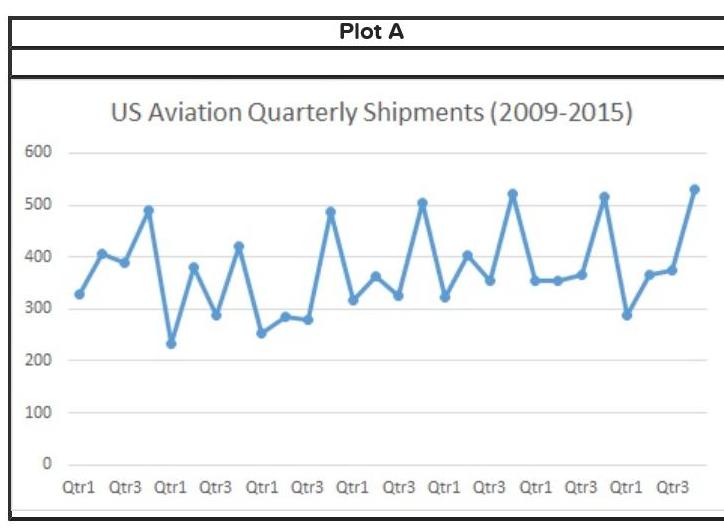
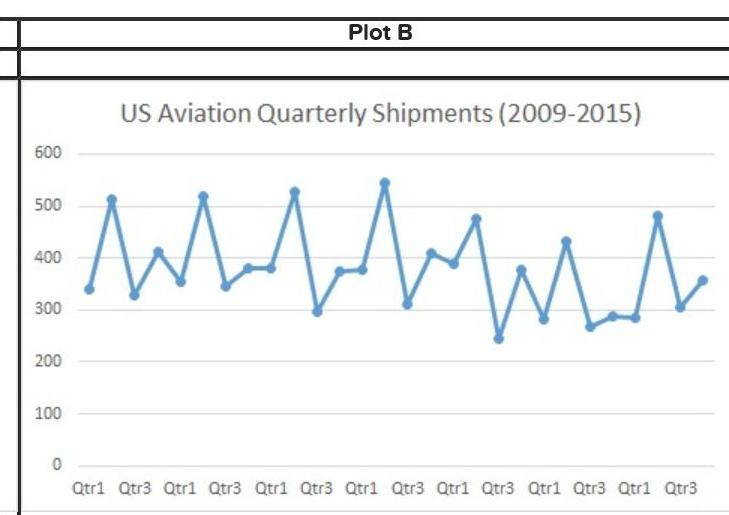
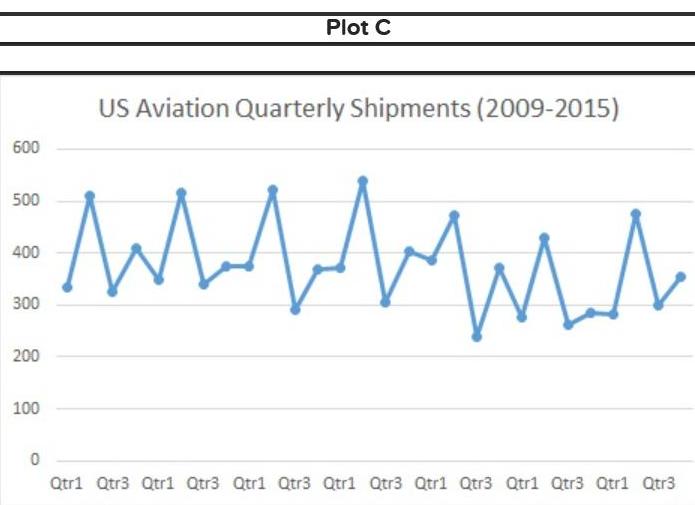
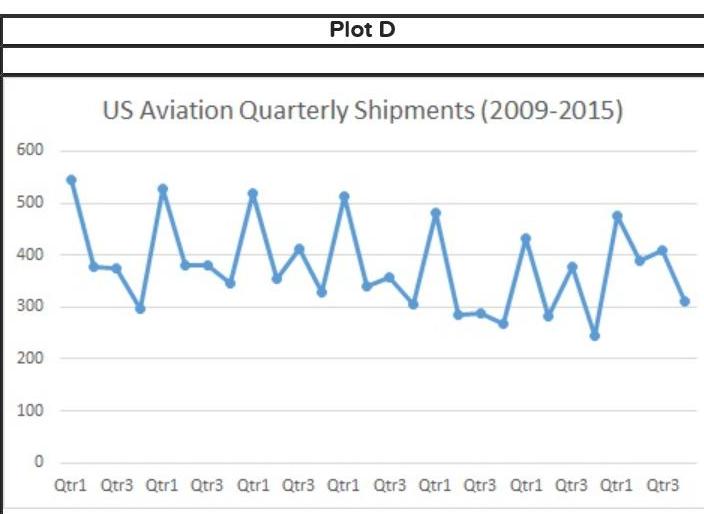
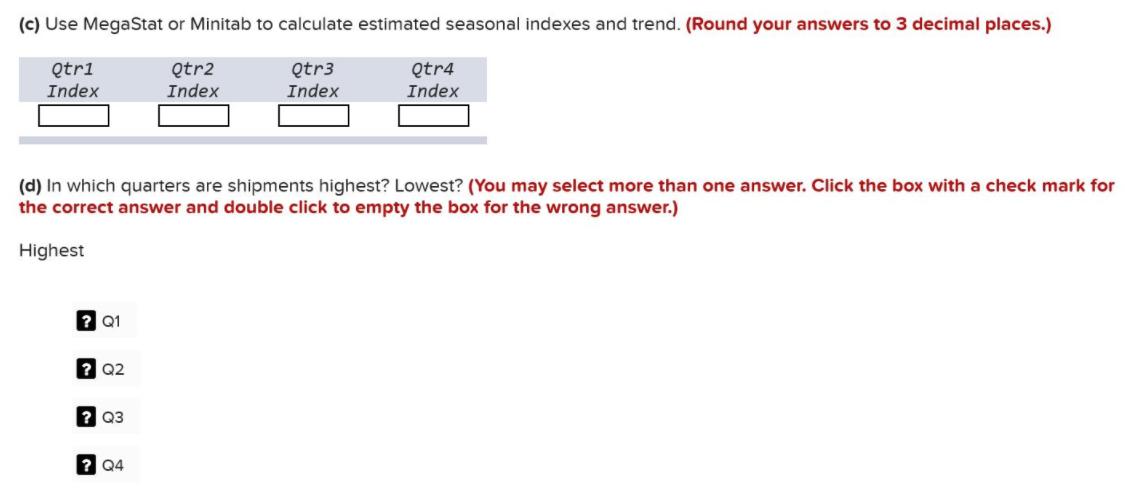
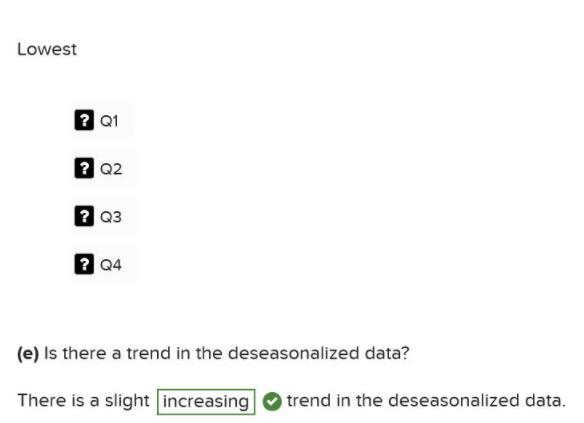
(a) Plot the data on airplane shipments. U.S. Manufactured General Aviation Shipments, 2009- 2015 Year Qtr 1 Qtr 2 Qtr 3 Qtr 4 Total 1,613 1,323 1,306 1,510 2009 328 407 389 489 2010 232 380 289 422 2011 254 285 279 488 2012 317 363 326 504 321 1,600 1,590 1,556 2013 403 355 521 2014 354 354 366 516 2015 287 365 374 530 Plot A US Aviation Quarterly Shipments (2009-2015) 600 500 400 300 200 100 Qtrl Qtr3 Qtr1 Qtr3 Qtr1 Qtr3 Qtr1 Qtr3 Qtr1 Qtr3 Qtr1 Qtr3 Qtr1 Qtr3 Plot B US Aviation Quarterly Shipments (2009-2015) 600 500 400 300 200 100 Qtr1 Qtr3 Qtrl Qtr3 Qtr1 Qtr3 Qtr1 Qtr3 Qtrl Qtr3 Qtr1 Qtr3 Qtr1 Qtr3 Plot C US Aviation Quarterly Shipments (2009-2015) 600 500 400 300 200 100 Qtr1 Qtr3 Qtr1 Qtr3 Qtr1 Qtr3 Qtr1 Qtr3 Qtrl Qtr3 Qtr1 Qtr3 Qtr1 Qtr3 Plot D US Aviation Quarterly Shipments (2009-2015) 600 500 400 300 200 100 Qtr1 Qtr3 Qtr1 Qtr3 Qtr1 Qtr3 Qtr1 Qtr3 Qtr1 Qtr3 Qtr1 Qtr3 Qtr1 Qtr3 (c) Use MegaStat or Minitab to calculate estimated seasonal indexes and trend. (Round your answers to 3 decimal places.) Qtr1 Index Qtr4 Qtr2 Index Qtr3 Index Index (d) In which quarters are shipments highest? Lowest? (You may select more than one answer. Click the box with a check mark for the correct answer and double click to empty the box for the wrong answer.) Highest ? Q1 ? Q2 ? Q3 2 Q4 Lowest ?Q1 2 Q2 2 Q3 2 Q4 (e) Is there a trend in the deseasonalized data? There is a slight increasing trend in the deseasonalized data.
Step by Step Solution
3.33 Rating (150 Votes )
There are 3 Steps involved in it
To solve this problem lets break down the steps needed to correctly identify the plot that matches t... View full answer

Get step-by-step solutions from verified subject matter experts