

Question: What forecasts can be made using the fitted trend models for the years 2017-2019.(See Below graph/pic) What is the linear, quadratic, exponential for t 11,
What forecasts can be made using the fitted trend models for the years 2017-2019.(See Below graph/pic)
What is the linear, quadratic, exponential for t 11, t 12, and t 13
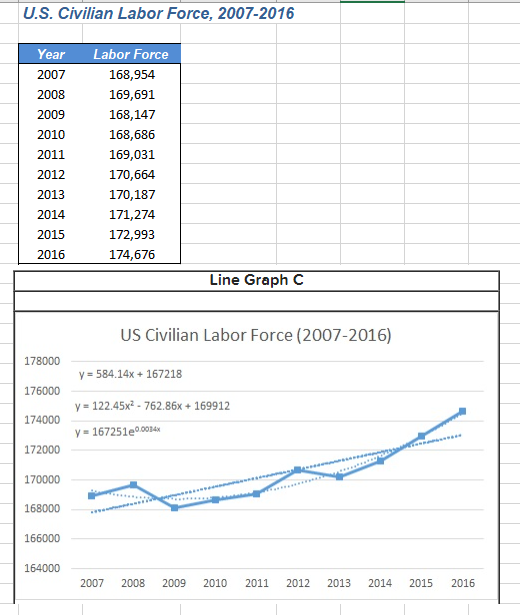
U.S. Civilian Labor Force, 2007-2016 Year Labor Force 2007 168,954 2008 169,691 2009 168,147 2010 168,686 2011 169,031 2012 170,664 2013 170,187 2014 171,274 2015 172,993 2016 174,676 Line Graph C US Civilian Labor Force (2007-2016) 178000 y = 584.14x + 167218 176000 y = 122.45x2 - 762.86x + 169912 174000 y = 1672510.0914x 172000 170000 168000 166000 164000 2007 2008 2009 2010 2011 2012 2013 2014 2015 2016
Step by Step Solution
There are 3 Steps involved in it
1 Expert Approved Answer
Step: 1 Unlock

Question Has Been Solved by an Expert!
Get step-by-step solutions from verified subject matter experts
Step: 2 Unlock
Step: 3 Unlock