

Question: Economic 1. Graphing the consumption function from the MPC Consider a hypothetical economy in which the marginal propensity to consume (MPC) is 0.50. That is,
Economic
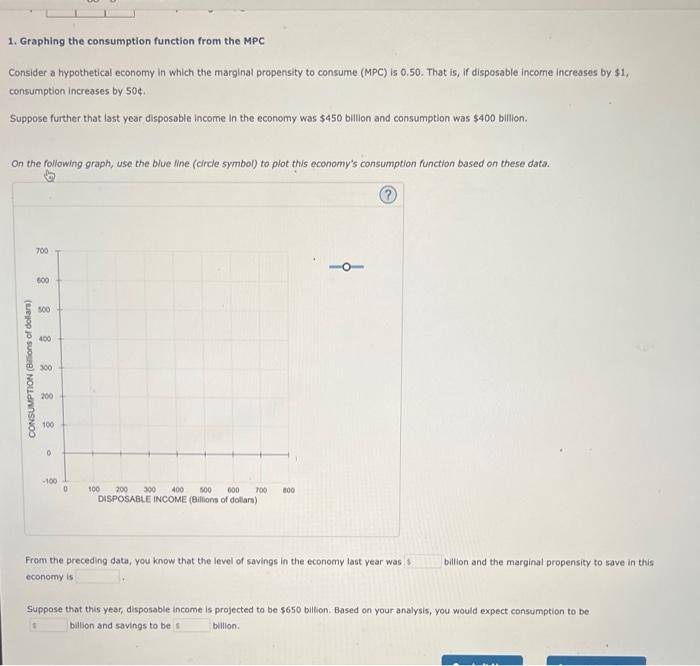
1. Graphing the consumption function from the MPC Consider a hypothetical economy in which the marginal propensity to consume (MPC) is 0.50. That is, if disposable income Increases by $1, consumption increases by 50c. Suppose further that last year disposable Income in the economy was $450 billion and consumption was $400 billion. On the following graph, use the blue line (circle symbol) to plot this economy's consumption function based on these data. 700 - 0- 809 500 CONSUMPTION (Billions of dollars) 300 200 100 290 300 400 800 000 109 "DISPOSABLE INCOME (Billions of dollars) From the preceding data, you know that the level of savings in the economy last year was to billion and the marginal propensity to save in this economy is Suppose that this year, disposable income is projected to be $650 billion, Based on your analysis, you would expect consumption to be billion and savings to be billion
Step by Step Solution
There are 3 Steps involved in it

Get step-by-step solutions from verified subject matter experts