

Question: Graphing the consumption function from the M P C Consider a hypothetical economy i n which the marginal propensity t o consume ( M P
Graphing the consumption function from the
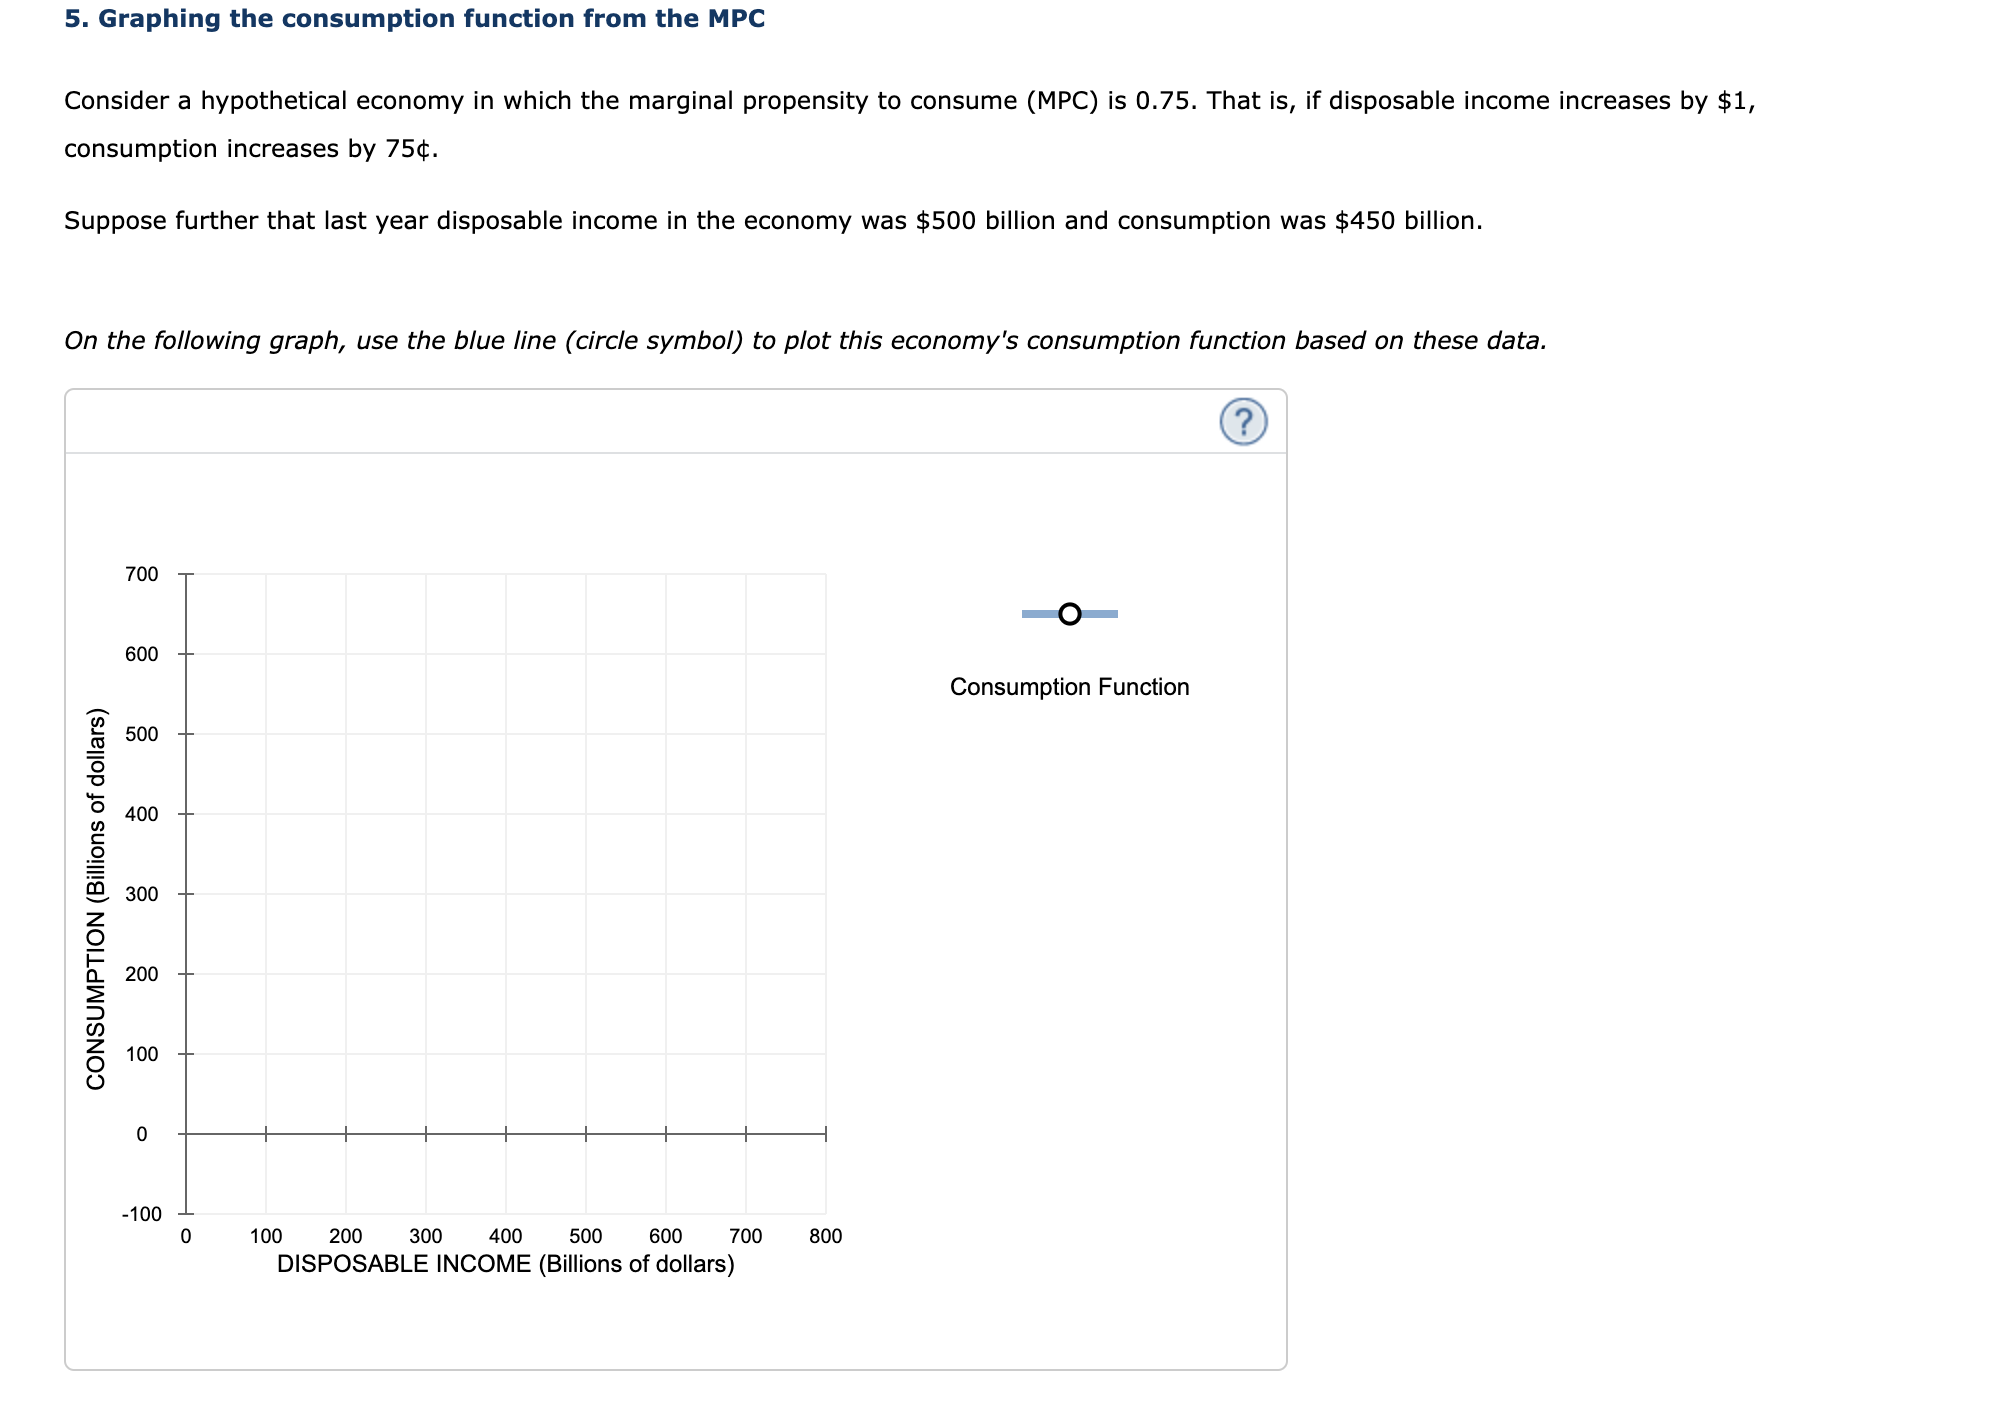
Consider a hypothetical economy which the marginal propensity consume That disposable income increases $
consumption increases $
Suppose further that last year disposable income the economy was $ billion and consumption was $ billion.
the following graph, use the blue line symbol plot this economy's consumption function based these data. From the preceding data, you know that the level saving the economy last year was
billion and the marginal propensity save this
economy
Suppose that this year, disposable income projected $ billion.
Please look pictures and make image the graph thank you!
Step by Step Solution
There are 3 Steps involved in it
1 Expert Approved Answer
Step: 1 Unlock

Question Has Been Solved by an Expert!
Get step-by-step solutions from verified subject matter experts
Step: 2 Unlock
Step: 3 Unlock