

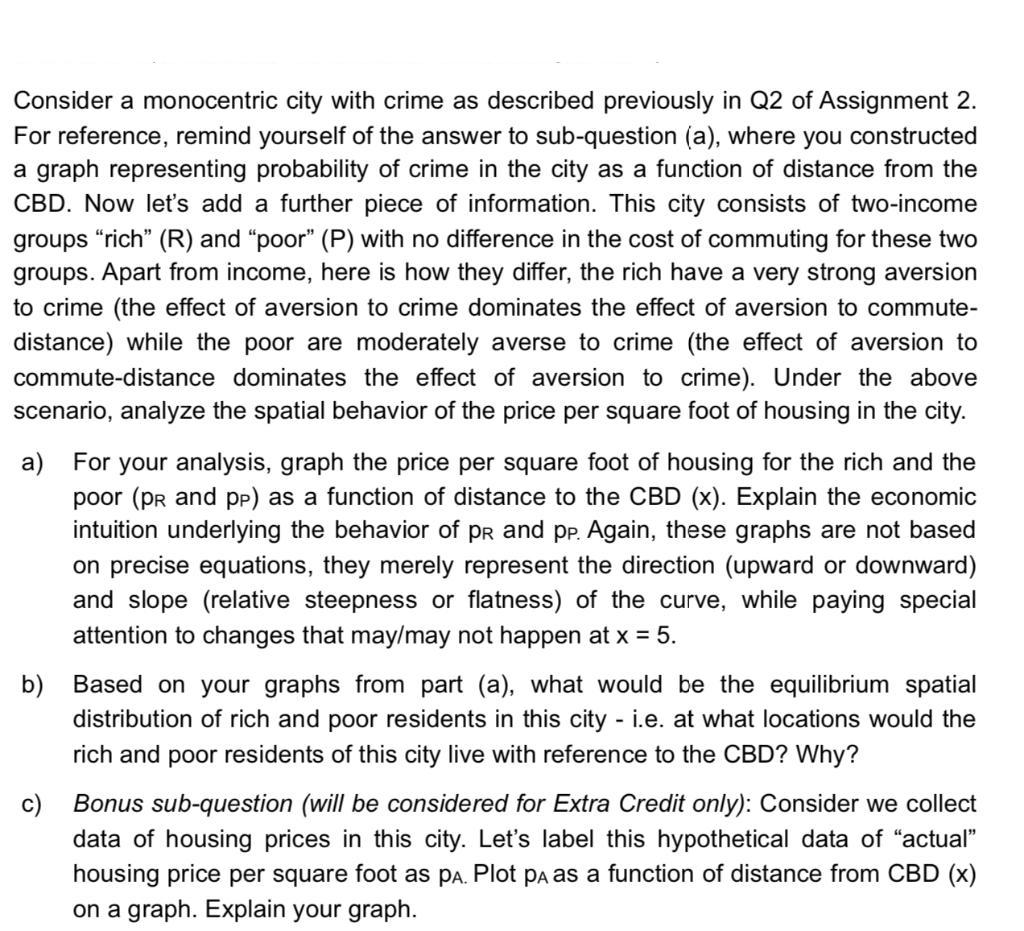
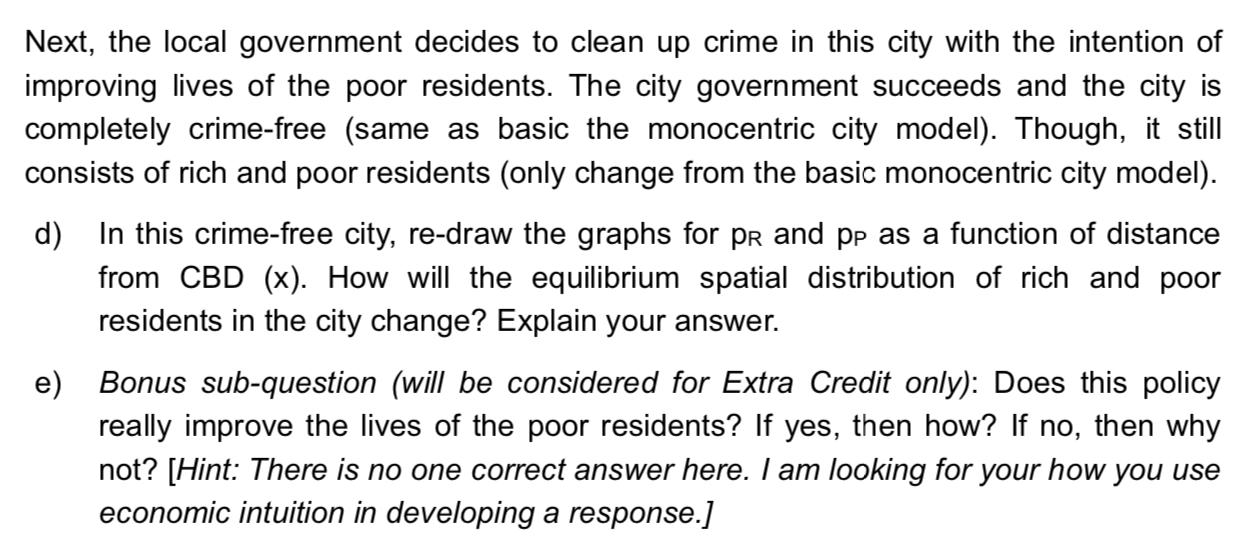
Consider a monocentric city with crime as described previously in Q2 of Assignment 2. For reference,...
Fantastic news! We've Found the answer you've been seeking!
Question:
Expert Answer:
a In this scenario we have two income groups the rich R and the poor P with different aversions to crime and commute distance The price per square foot of housing for each income group will be influen... View the full answer

Related Book For 

Introduction to Probability and Statistics
ISBN: 978-1133103752
14th edition
Authors: William Mendenhall, Robert Beaver, Barbara Beaver
Posted Date:
