

Question: Engineering Data Analysis 1.) Interpret the results shown in the graph of the residuals plotted against the treatment levels. Homework 1 Analysis Plot of residuals'salt.
Engineering Data Analysis
1.) Interpret the results shown in the graph of the residuals plotted against the treatment levels.
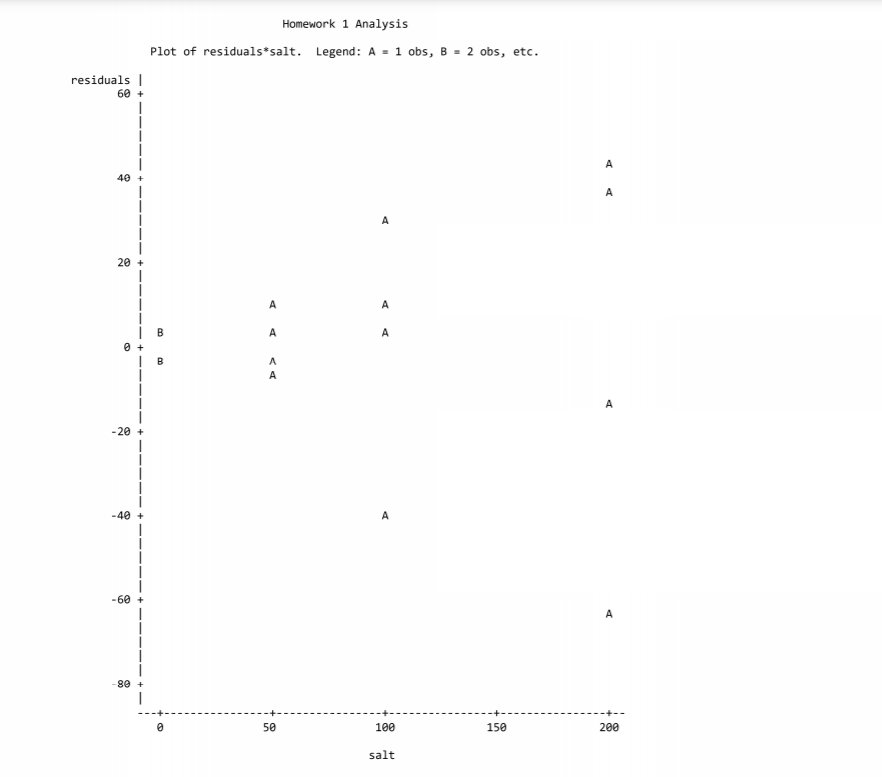
Homework 1 Analysis Plot of residuals'salt. Legend: A - 1 obs, B - 2 obs, etc. residuals I 53 + | | | | l 43 + | I | A | I 23 + | I I A A | | a A A B + | a A | A | | I 43 + | I l | | um + It | | I | I '63 + | I l | | -59 + I + + + + + B 53 193 158I
Step by Step Solution
There are 3 Steps involved in it
1 Expert Approved Answer
Step: 1 Unlock

Question Has Been Solved by an Expert!
Get step-by-step solutions from verified subject matter experts
Step: 2 Unlock
Step: 3 Unlock