

Question: es a Calculate the centerline the upper control limit UCL and the lower control limit LCL for the chart if samples of size 9 are

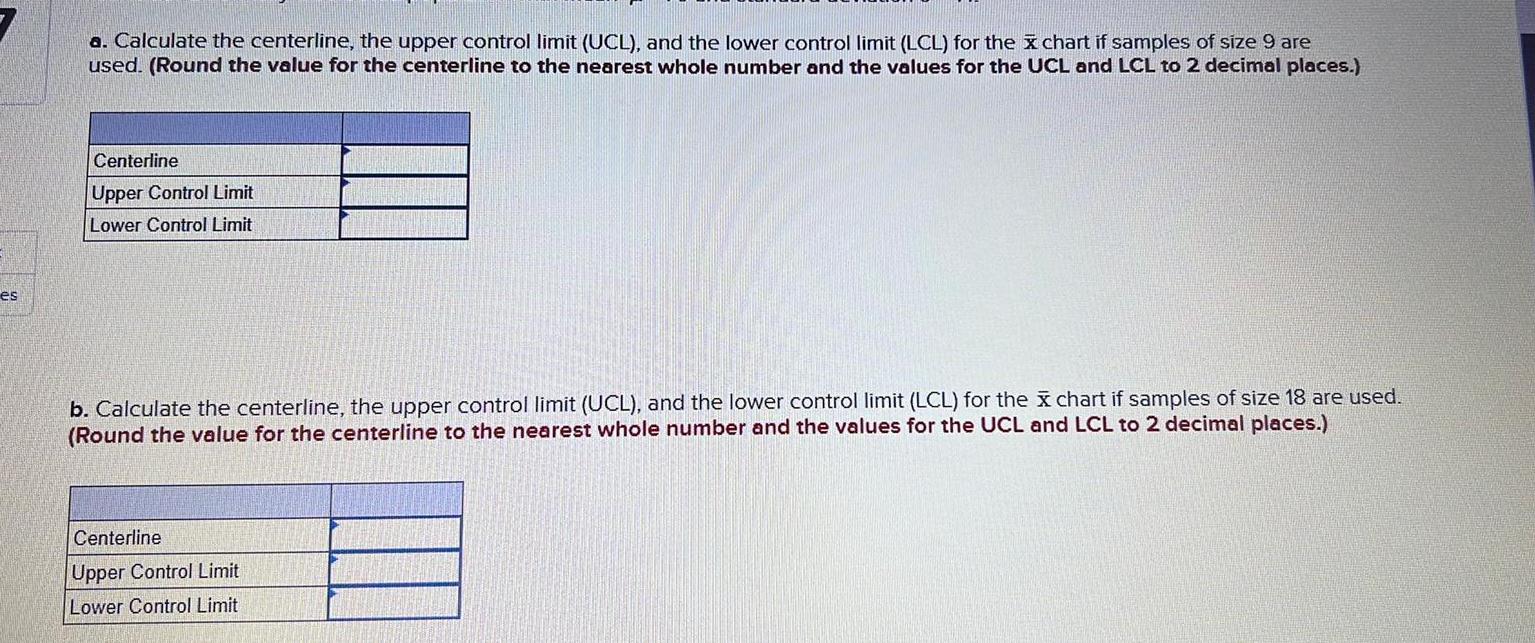
es a Calculate the centerline the upper control limit UCL and the lower control limit LCL for the chart if samples of size 9 are used Round the value for the centerline to the nearest whole number and the values for the UCL and LCL to 2 decimal places Centerline Upper Control Limit Lower Control Limit b Calculate the centerline the upper control limit UCL and the lower control limit LCL for the x chart if samples of size 18 are used Round the value for the centerline to the nearest whole number and the values for the UCL and LCL to 2 decimal places Centerline Upper Control Limit Lower Control Limit
Step by Step Solution
There are 3 Steps involved in it
1 Expert Approved Answer
Step: 1 Unlock

Question Has Been Solved by an Expert!
Get step-by-step solutions from verified subject matter experts
Step: 2 Unlock
Step: 3 Unlock