Question: Estimating Share Value Using the ROPI Model Following are forecasted sales, NOPAT, and NOA for AT&T for 2019 through 2022 a. Forecast the terminal period
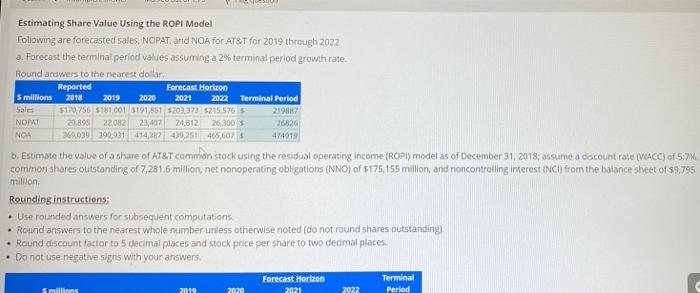
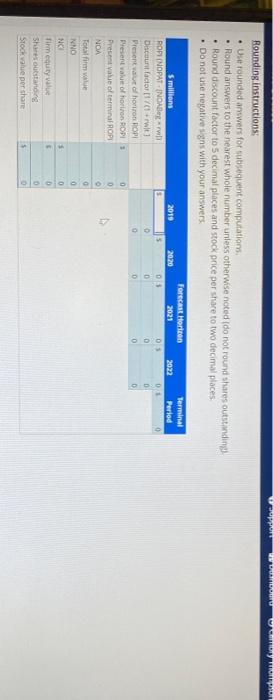
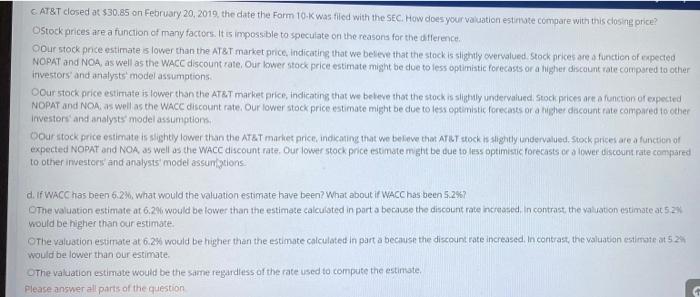
Estimating Share Value Using the ROPI Model Following are forecasted sales, NOPAT, and NOA for AT&T for 2019 through 2022 a. Forecast the terminal period values assuming a 2% terminal period growth rate Round answers to the nearest dollar Reported Forecast Horizon 5 millions 2014 2019 2020 2021 2022 Terminal Period Sales $120.756 5181001 $191,851 5203.373 5215 576 5 219067 NORMT 29895 22082 23,407 24,812 26,300 36826 NOA 269.029 190,931 414,382439,251 465,60% 474019 D. Estimate the value of a share of AT&T common stock using the residual operating income (ROP) model as of December 31, 2018; assume a discount rate (WACC) of 5.7 common shares outstanding of 7,281.6 million, net nonoperating obligations (NNO) of $175,155 million, and noncontroling interest inci) from the balance sheet of 59,795 million Rounding instructions Use rounded answers for subsequent computations Round answers to the nearest whole number unless otherwise noted (do not round shares outstanding) Round discount factor to 5 decimal places and stock price per share to two decimal places. Do not use negative signs with your answers Forecast Horizon Terminal 2020 2021 2022 Period millions 2019 PON D Rounding instructions Use rounded answers for subsequent computations Round answers to the nearest whole number unless otherwise noted (do not round shares outstanding Round discount factor to 5 decimal places and stock price per share to two decimal places Do not use negative ans with your answers Forecast Hercen Terminal Smillions 2019 20:20 2021 2022 Period ROP (NOPATINOABegrill 05 OS Dacount factor/(1rwit 0 Present value of honron ROP 0 0 Present value of horizon ROPI 1 Present value of terminal ROPI 0 NOA Totalfi wa NNO NC firm equity value Share outstanding Stock value per share 0 0 OOOOOOOOO 1 CAT&T closed at $30.85 on February 20, 2019. the date the Form 10-K was filed with the SEC. How does your valuation estimate compare with this closing price? Ostock prices are a function of many factors. It is impossible to speculate on the reasons for the difference pour stock price estimate s lower than the AT&T market price, indicating that we believe that the stock is slightly overvalued. Stock prices are a function of expected NOPAT and NOA, as well as the WACC discount rate. Our lower stock price estimate might be due to less optimistic forecasts or a higher discount vate compared to other investors and analysts' model assumptions. Cour stock price estimate is lower than the AT&T market price, indicating that we beleve that the stock is slightly undervalued Stock prices are a function of expected NOPAT and NOA, as well as the WACC discount rate. Our lower stock price estimate might be due to less optimistic forecasts or a nigher discount rate compared to other investors and analysts model assumptions Oour stock price estimates slightly lower than the AT&T market price, indicating that we believe that ATT stock is slightly undervalued. Stock pricevare a function of expected NOPAT and NOA as well as the WACC discount rate. Our lower stock price estimate might be due to less optimistic forecasts or a lower discount rate compared to other investors and analysts' model assuntions d. If WACC has been 6.2%, what would the valuation estimate have been? What about if WACC has been 5.2%? The valuation estimate at 6.2% would be lower than the estimate calculated in part a because the discount rate increased. In contrast, the valuation estimate at 52 would be higher than our estimate The valuation estimate at 6.2% would be higher than the estimate calculated in part a because the discount rate increased. In contrast, the valuation estimate at 52 would be lower than our estimate The valuation estimate would be the same regardless of the rate used to compute the estimate Please answer all parts of the question Estimating Share Value Using the ROPI Model Following are forecasted sales, NOPAT, and NOA for AT&T for 2019 through 2022 a. Forecast the terminal period values assuming a 2% terminal period growth rate Round answers to the nearest dollar Reported Forecast Horizon 5 millions 2014 2019 2020 2021 2022 Terminal Period Sales $120.756 5181001 $191,851 5203.373 5215 576 5 219067 NORMT 29895 22082 23,407 24,812 26,300 36826 NOA 269.029 190,931 414,382439,251 465,60% 474019 D. Estimate the value of a share of AT&T common stock using the residual operating income (ROP) model as of December 31, 2018; assume a discount rate (WACC) of 5.7 common shares outstanding of 7,281.6 million, net nonoperating obligations (NNO) of $175,155 million, and noncontroling interest inci) from the balance sheet of 59,795 million Rounding instructions Use rounded answers for subsequent computations Round answers to the nearest whole number unless otherwise noted (do not round shares outstanding) Round discount factor to 5 decimal places and stock price per share to two decimal places. Do not use negative signs with your answers Forecast Horizon Terminal 2020 2021 2022 Period millions 2019 PON D Rounding instructions Use rounded answers for subsequent computations Round answers to the nearest whole number unless otherwise noted (do not round shares outstanding Round discount factor to 5 decimal places and stock price per share to two decimal places Do not use negative ans with your answers Forecast Hercen Terminal Smillions 2019 20:20 2021 2022 Period ROP (NOPATINOABegrill 05 OS Dacount factor/(1rwit 0 Present value of honron ROP 0 0 Present value of horizon ROPI 1 Present value of terminal ROPI 0 NOA Totalfi wa NNO NC firm equity value Share outstanding Stock value per share 0 0 OOOOOOOOO 1 CAT&T closed at $30.85 on February 20, 2019. the date the Form 10-K was filed with the SEC. How does your valuation estimate compare with this closing price? Ostock prices are a function of many factors. It is impossible to speculate on the reasons for the difference pour stock price estimate s lower than the AT&T market price, indicating that we believe that the stock is slightly overvalued. Stock prices are a function of expected NOPAT and NOA, as well as the WACC discount rate. Our lower stock price estimate might be due to less optimistic forecasts or a higher discount vate compared to other investors and analysts' model assumptions. Cour stock price estimate is lower than the AT&T market price, indicating that we beleve that the stock is slightly undervalued Stock prices are a function of expected NOPAT and NOA, as well as the WACC discount rate. Our lower stock price estimate might be due to less optimistic forecasts or a nigher discount rate compared to other investors and analysts model assumptions Oour stock price estimates slightly lower than the AT&T market price, indicating that we believe that ATT stock is slightly undervalued. Stock pricevare a function of expected NOPAT and NOA as well as the WACC discount rate. Our lower stock price estimate might be due to less optimistic forecasts or a lower discount rate compared to other investors and analysts' model assuntions d. If WACC has been 6.2%, what would the valuation estimate have been? What about if WACC has been 5.2%? The valuation estimate at 6.2% would be lower than the estimate calculated in part a because the discount rate increased. In contrast, the valuation estimate at 52 would be higher than our estimate The valuation estimate at 6.2% would be higher than the estimate calculated in part a because the discount rate increased. In contrast, the valuation estimate at 52 would be lower than our estimate The valuation estimate would be the same regardless of the rate used to compute the estimate Please answer all parts of the