

Evaluate the financial health of the company using financial ratio analysis; get financial data (time period...
Fantastic news! We've Found the answer you've been seeking!
Question:
Transcribed Image Text:
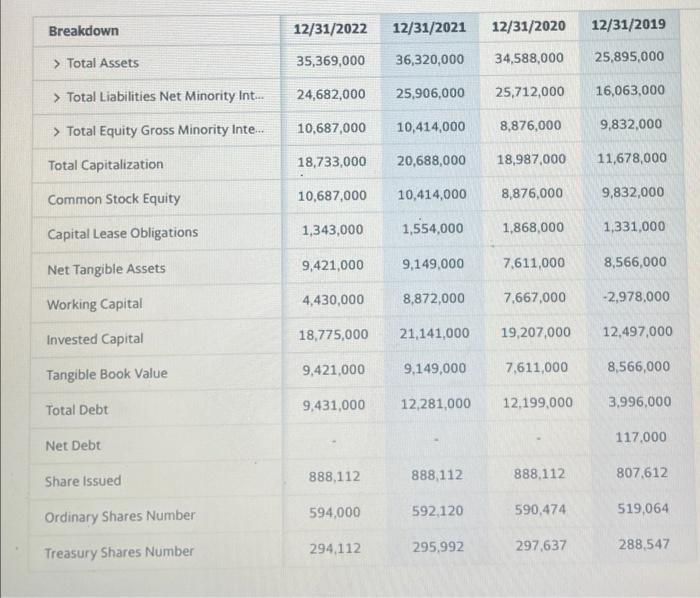
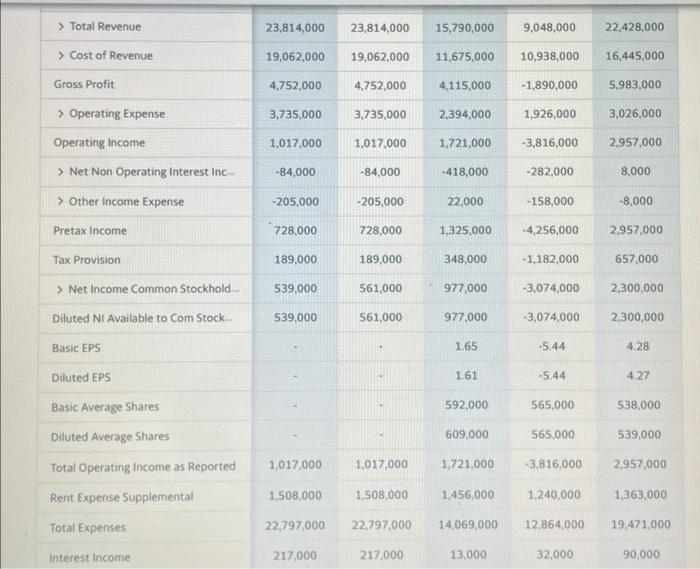
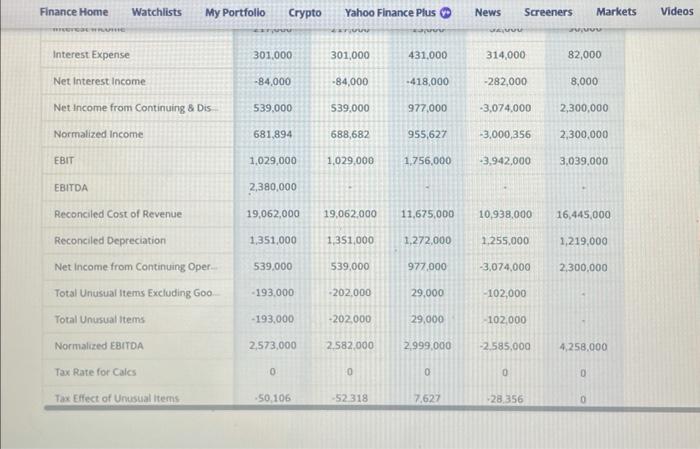
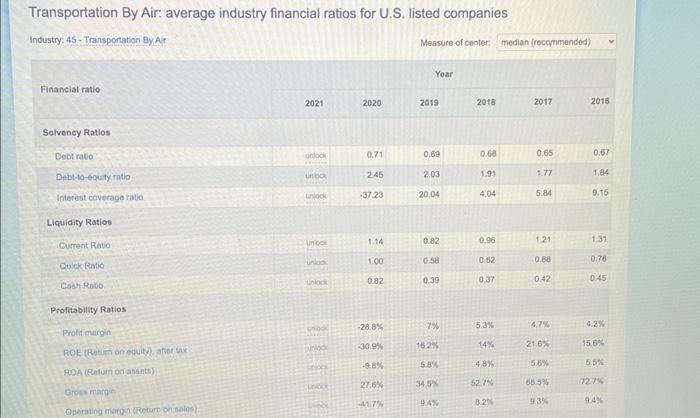
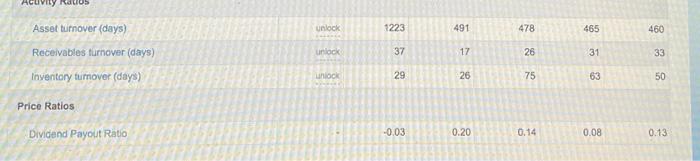
Evaluate the financial health of the company using financial ratio analysis; get financial data (time period of the case) if the case does not provide it (http:finance.yahoo.com/) Make sure you benchmark it against rivals or industry average. Breakdown > Total Assets > Total Liabilities Net Minority Int..... > Total Equity Gross Minority Inte... Total Capitalization Common Stock Equity Capital Lease Obligations Net Tangible Assets Working Capital Invested Capital Tangible Book Value Total Debt Net Debt Share Issued Ordinary Shares Number Treasury Shares Number 12/31/2022 12/31/2021 35,369,000 24,682,000 25,906,000 10,687,000 10,687,000 18,733,000 20,688,000 1,343,000 9,421,000 4,430,000 18,775,000 9,421,000 9,431,000 12/31/2020 12/31/2019 36,320,000 34,588,000 25,895,000 16,063,000 9,832,000 11,678,000 9,832,000 1,331,000 8,566,000 -2,978,000 888,112 594,000 294,112 10,414,000 10,414,000 1,554,000 9,149,000 8,872,000 21,141,000 9,149,000 12,281,000 888,112 592,120 295,992 25,712,000 8,876,000 18,987,000 8,876,000 1,868,000 7,611,000 7,667,000 19,207,000 7,611,000 12,199,000 888,112 590,474 297,637 12,497,000 8,566,000 3,996,000 117.000 807,612 519,064 288,547 > Total Revenue > Cost of Revenue Gross Profit > Operating Expense Operating Income > Net Non Operating Interest Inc... > Other Income Expense Pretax Income Tax Provision > Net Income Common Stockhold.... Diluted NI Available to Com Stock... Basic EPS Diluted EPS Basic Average Shares Diluted Average Shares Total Operating Income as Reported Rent Expense Supplemental Total Expenses Interest Income 23,814,000 23,814,000 15,790,000 9,048,000 19,062,000 19,062,000 11,675,000 10,938,000 4,752,000 3,735,000 1,017,000 -84,000 -205,000 728,000 189,000 539,000 539,000 1,017,000 1,508,000 22,797,000 217,000 4,752,000 3,735,000 1,017,000 -84,000 -205,000 728,000 189,000 561,000 561,000 1,017,000 1,508,000 4,115,000 217,000 2,394,000 1,721,000 -418,000 22,000 1,325,000 348,000 977,000 977,000 1.65 1.61 592,000 609,000 1,721,000 1.456,000 22,797,000 14,069,000 13,000 -1,890,000 1,926,000 -3,816,000 -282,000 -158,000 -4,256,000 -1,182,000 -3,074,000 -3,074,000 -5.44 -5.44 565,000 565,000 -3,816,000 1,240,000 12,864,000 32,000 22,428,000 16,445,000 5,983,000 3,026,000 2,957,000 8,000 -8,000 2,957,000 657,000 2,300,000 2,300,000 4.28 4.27 538,000 539,000 2,957,000 1,363,000 19,471,000 90,000 Finance Home BRETCH WRATIC Interest Expense Watchlists My Portfolio Net Interest Income Net Income from Continuing & Dis Normalized Income EBIT EBITDA Reconciled Cost of Revenue Reconciled Depreciation Net Income from Continuing Oper.... Total Unusual Items Excluding Go..... Total Unusual Items Normalized EBITDA Tax Rate for Calcs Tax Effect of Unusual Items Crypto 301,000 -84,000 539,000 681,894 1,029,000 2,380,000 19,062,000 1,351,000 539,000 -193,000 -193,000 2,573,000 0 -50,106 Yahoo Finance Plus 301,000 -84,000 $39.000 688,682 1,029,000 19,062.000 1,351,000 539,000 -202,000 -202,000 2.582,000 0 -52.318 Pov 431,000 -418,000 11,675,000 1,272,000 977,000 977,000 955,627 -3,000,356 1,756,000 -3,942,000 29,000 29,000 2,999,000 0 News Screeners Markets Videos 7,627 vvvv 314,000 -282,000 -3,074,000 10,938,000 1,255,000 -3,074,000 -102,000 -102,000 -2.585,000 0 -28,356 82,000 8,000 2,300,000 2,300,000 3,039,000 16,445,000 1,219,000 2,300,000 4,258,000 0 0 Transportation By Air: average industry financial ratios for U.S. listed companies Industry: 45- Transportation By Air Financial ratio Solvency Ratios Debt ratio Debt-to-equity ratio Interest coverage ratio Liquidity Ratios Current Ratio Quick Ratio Cash Ratio Profitability Ratios Profit margin ROE (Return on equity), after tax ROA (Return on assets) Gross margin Operating margin (Return on salos) 2021 unlock unbok unlock Unlock unlock unlock wrock unlock selok 2020 0.71 2:45 -37.23 1.14 1.00 0.82 -28.8% -30.9% -98% 27.6% -41.7% Measure of center: median (recommended) Year 2019 0,69 2.03 20.04 0.82 0.58 0.39 7% 16.2% 5.8% 34,5% 9.4% 2018 0.68 1.91 4.04 0.96 0.62 0.37 5.3% 14% 4,8% 52.7% 8.2% 2017 0.65 1.77 5.84 1.21 0.88 0.42 4.7% 21.6% 5.6% 66.5% 9.3% 2016 0.67 1.84 9.15 1.31 0.76 0.45 4.2% 15.6% 5.5% 72.7% 9.4% Asset turnover (days) Receivables turnover (days) Inventory turnover (days) Price Ratios Dividend Payout Ratio unlock unlock unlock 1223 37 29 -0.03 491 17 26 0.20 478 26 75 0.14 465 31 63 0.08 460 33 50 0.13 Evaluate the financial health of the company using financial ratio analysis; get financial data (time period of the case) if the case does not provide it (http:finance.yahoo.com/) Make sure you benchmark it against rivals or industry average. Breakdown > Total Assets > Total Liabilities Net Minority Int..... > Total Equity Gross Minority Inte... Total Capitalization Common Stock Equity Capital Lease Obligations Net Tangible Assets Working Capital Invested Capital Tangible Book Value Total Debt Net Debt Share Issued Ordinary Shares Number Treasury Shares Number 12/31/2022 12/31/2021 35,369,000 24,682,000 25,906,000 10,687,000 10,687,000 18,733,000 20,688,000 1,343,000 9,421,000 4,430,000 18,775,000 9,421,000 9,431,000 12/31/2020 12/31/2019 36,320,000 34,588,000 25,895,000 16,063,000 9,832,000 11,678,000 9,832,000 1,331,000 8,566,000 -2,978,000 888,112 594,000 294,112 10,414,000 10,414,000 1,554,000 9,149,000 8,872,000 21,141,000 9,149,000 12,281,000 888,112 592,120 295,992 25,712,000 8,876,000 18,987,000 8,876,000 1,868,000 7,611,000 7,667,000 19,207,000 7,611,000 12,199,000 888,112 590,474 297,637 12,497,000 8,566,000 3,996,000 117.000 807,612 519,064 288,547 > Total Revenue > Cost of Revenue Gross Profit > Operating Expense Operating Income > Net Non Operating Interest Inc... > Other Income Expense Pretax Income Tax Provision > Net Income Common Stockhold.... Diluted NI Available to Com Stock... Basic EPS Diluted EPS Basic Average Shares Diluted Average Shares Total Operating Income as Reported Rent Expense Supplemental Total Expenses Interest Income 23,814,000 23,814,000 15,790,000 9,048,000 19,062,000 19,062,000 11,675,000 10,938,000 4,752,000 3,735,000 1,017,000 -84,000 -205,000 728,000 189,000 539,000 539,000 1,017,000 1,508,000 22,797,000 217,000 4,752,000 3,735,000 1,017,000 -84,000 -205,000 728,000 189,000 561,000 561,000 1,017,000 1,508,000 4,115,000 217,000 2,394,000 1,721,000 -418,000 22,000 1,325,000 348,000 977,000 977,000 1.65 1.61 592,000 609,000 1,721,000 1.456,000 22,797,000 14,069,000 13,000 -1,890,000 1,926,000 -3,816,000 -282,000 -158,000 -4,256,000 -1,182,000 -3,074,000 -3,074,000 -5.44 -5.44 565,000 565,000 -3,816,000 1,240,000 12,864,000 32,000 22,428,000 16,445,000 5,983,000 3,026,000 2,957,000 8,000 -8,000 2,957,000 657,000 2,300,000 2,300,000 4.28 4.27 538,000 539,000 2,957,000 1,363,000 19,471,000 90,000 Finance Home BRETCH WRATIC Interest Expense Watchlists My Portfolio Net Interest Income Net Income from Continuing & Dis Normalized Income EBIT EBITDA Reconciled Cost of Revenue Reconciled Depreciation Net Income from Continuing Oper.... Total Unusual Items Excluding Go..... Total Unusual Items Normalized EBITDA Tax Rate for Calcs Tax Effect of Unusual Items Crypto 301,000 -84,000 539,000 681,894 1,029,000 2,380,000 19,062,000 1,351,000 539,000 -193,000 -193,000 2,573,000 0 -50,106 Yahoo Finance Plus 301,000 -84,000 $39.000 688,682 1,029,000 19,062.000 1,351,000 539,000 -202,000 -202,000 2.582,000 0 -52.318 Pov 431,000 -418,000 11,675,000 1,272,000 977,000 977,000 955,627 -3,000,356 1,756,000 -3,942,000 29,000 29,000 2,999,000 0 News Screeners Markets Videos 7,627 vvvv 314,000 -282,000 -3,074,000 10,938,000 1,255,000 -3,074,000 -102,000 -102,000 -2.585,000 0 -28,356 82,000 8,000 2,300,000 2,300,000 3,039,000 16,445,000 1,219,000 2,300,000 4,258,000 0 0 Transportation By Air: average industry financial ratios for U.S. listed companies Industry: 45- Transportation By Air Financial ratio Solvency Ratios Debt ratio Debt-to-equity ratio Interest coverage ratio Liquidity Ratios Current Ratio Quick Ratio Cash Ratio Profitability Ratios Profit margin ROE (Return on equity), after tax ROA (Return on assets) Gross margin Operating margin (Return on salos) 2021 unlock unbok unlock Unlock unlock unlock wrock unlock selok 2020 0.71 2:45 -37.23 1.14 1.00 0.82 -28.8% -30.9% -98% 27.6% -41.7% Measure of center: median (recommended) Year 2019 0,69 2.03 20.04 0.82 0.58 0.39 7% 16.2% 5.8% 34,5% 9.4% 2018 0.68 1.91 4.04 0.96 0.62 0.37 5.3% 14% 4,8% 52.7% 8.2% 2017 0.65 1.77 5.84 1.21 0.88 0.42 4.7% 21.6% 5.6% 66.5% 9.3% 2016 0.67 1.84 9.15 1.31 0.76 0.45 4.2% 15.6% 5.5% 72.7% 9.4% Asset turnover (days) Receivables turnover (days) Inventory turnover (days) Price Ratios Dividend Payout Ratio unlock unlock unlock 1223 37 29 -0.03 491 17 26 0.20 478 26 75 0.14 465 31 63 0.08 460 33 50 0.13
Expert Answer:
Answer rating: 100% (QA)
Based on the screenshots youve provided which include various financial figures from balance sheets and income statements as well as some industry average ratios we can perform a financial ratio analy... View the full answer

Related Book For 

Income Tax Fundamentals 2013
ISBN: 9781285586618
31st Edition
Authors: Gerald E. Whittenburg, Martha Altus Buller, Steven L Gill
Posted Date:
Students also viewed these finance questions
-
Choose one of the two competitors that you explored in your Topic 3 paper. Create an executive summary presentation of the findings on the chosen company from the Topic 3 report (seven to nine...
-
List three specific parts of the Case Guide, Objectives and Strategy Section (See below) that you had the most difficulty understanding. Describe your current understanding of these parts. Provide...
-
Financial ratios are used to analyze a companys strengths and weaknesses by looking at the ratio of various financial data to each other by financial and business analysts and investors. Ratios thus...
-
Under what circumstances should derived associations be used?
-
Compare the mean squared errors of b1 and b1.2 in Section 8.2.2.
-
The velocity field for steady inviscid flow from left to right over a circular cylinder, of radius \(R\) is given by \[\vec{V}=U \cos \theta\left[1-\left(\frac{R}{r} ight)^{2} ight] \hat{e}_{r}-U...
-
How the California court system is structured
-
MCO Leather Goods manufactures leather purses. Each purse requires 2 pounds of direct materials at a cost of $4 per pound and 0.8 direct labor hours at a rate of $16 per hour. Variable manufacturing...
-
Part U67 is used in one of Broce Corporation\'s products. The company\'s Accounting Department reports the following costs of producing the 16,800 units of the part that are needed every year. Per...
-
Find the risk-neutral probabilities and zero cost date 0 forward prices (for settlement at date 1) for the stock in exercise 7.2. As in that exercise, assume a risk-free rate of 15% per period. 7.2....
-
Economics 3. Suppose that a worker has T hours per week of time that can be allocated to any combination of leisure (L) and market work (N = T?L). The workers preferences are described by the utility...
-
List and explain the important factors that should be considered in the organizing process.
-
What are the differences between the traditional venture capital method and the first Chicago method?
-
What is the ROP? Explain and give numerical example to calculate it.
-
What is market research and how can it be used to forecast sales, for example?
-
List and explain at least four types of retail store interior layout, and give the main purpose for each.
-
Consider the following relational schemas, namely Employee, WorkOn, and Project. Employee (eid, ename, age, supv_eid) WorkOn (eid, pid) Project (pid, pname, year) The key fields are bold. WorkOn.eid...
-
Answer the following two independent questions. a. MM Corporation is considering several proposed investments for the coming budget year. MM produces electrical apparatus for industrial complexes....
-
Carol Harris, Ph.D, CPA, is a single taxpayer and she lives at 674 Yankee Street, Durham, NC 27409. Her Social Security number is 793-52-4335. Carol is an Associate Professor of Accounting at a local...
-
Mike sells his home to Jane on April 2, 2012. Jane pays the property taxes covering the full calendar year in October, which amount to $2,500. How much may Mike and Jane each deduct for property...
-
Karim Depak received a Form 1099-B showing the following stock transactions and basis during 2012: None of the stock is qualified small business stock. Calculate Karim's net capital gain or loss...
-
The heat of vaporization of ether is \(25.98 \mathrm{~kJ} / \mathrm{mol}\) at its boiling point, \(34.5^{\circ} \mathrm{C}\). (a) Calculate the rate of change of vapour pressure with temperature...
-
Show that the internal energy of an ideal gas is a function only of temperature.
-
For a gas obeying the equation of state \(V=B+\frac{R T}{P}\), the Joule-Thomson coefficient is given by \[ \mu_{\mathrm{JT}}=-\frac{1}{C_{P}}\left(T \frac{d B}{d T}-B ight) \]

Study smarter with the SolutionInn App