

Question: Evaluate the following project using the appropriate functions in Excel: t 1 2 3 4 5 Cash flow $ (40,000) 10,000 10,000 11,000 17,000 12,000
Evaluate the following project using the appropriate functions in Excel:
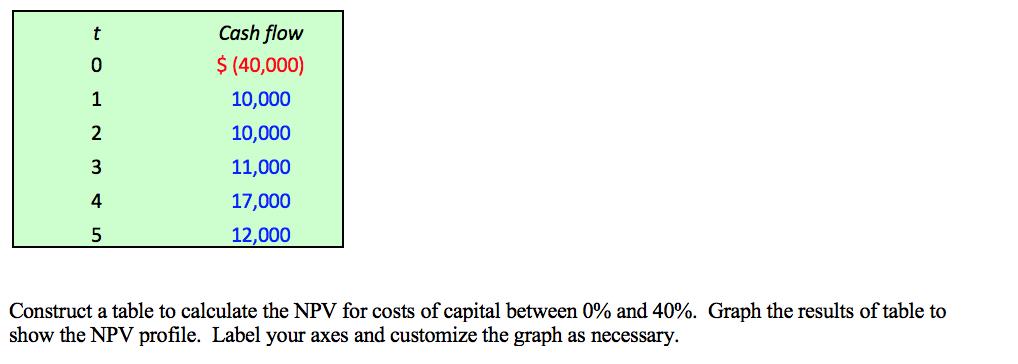
t 1 2 3 4 5 Cash flow $ (40,000) 10,000 10,000 11,000 17,000 12,000 Construct a table to calculate the NPV for costs of capital between 0% and 40%. Graph the results of table to show the NPV profile. Label your axes and customize the graph as necessary.
Step by Step Solution
There are 3 Steps involved in it
1 Expert Approved Answer
Step: 1 Unlock

Question Has Been Solved by an Expert!
Get step-by-step solutions from verified subject matter experts
Step: 2 Unlock
Step: 3 Unlock