Question: Evaluate the following using the table below. USL = 52, LSL = 29 All of the sample averages are within the control limits for averages.

Evaluate the following using the table below. USL = 52, LSL = 29 All of the sample averages are within the control limits for averages.Evaluate the following using the table below. USL

Date Average Range 04-Oct 31 40 39 371 39 37 44 38.1 13 05-Oct 38 43 40 36 43 42 40 40.3 7 06-Oct 38 37 31 41 39 39 35 37.1 10 07-Oct|38|43 38 41 39 39 40 39.7 5 08-Oct|39|38|41|4031|35 38 37.4 10 09-Oct 38 37 38 38 45 41 42 39.9 8 10-Oct|40|37|46|37|48|44| 41| 41.9 11 11-Oct|38|35|40| 41|40| 42| 40 39.4 7 12-Oct|40|42|39|41|40|35| 42 39.9 7 13-Oct|37|36 43 39 42 35 38 38.6 8 14-Oct| 38 41 40 39 39 38 41 39.4 3 15-Oct|41|44|39|36|36|46| 45 41.0 16-Oct|45|42|40) 38 39 41 43 41.1 7 17-Oct| 33 38 38 39 34 38 36 36.6 6 18-Oct|43|37| 40 39 38 32 46 39.3 14 19-Oct| 39|41 341 34|40|42 44 39.1 10 20-Oct|36|39|38|42|44|41 36 39.4 8 21-Oct| 39|44|3737 38 36 44 39.3 8 22-Oct|37|394339 41 43 41 40.4 6 23-Oct|43|42|42|44|40| 40 41 41.7 4 Avg 39.49 8.10 10 False True

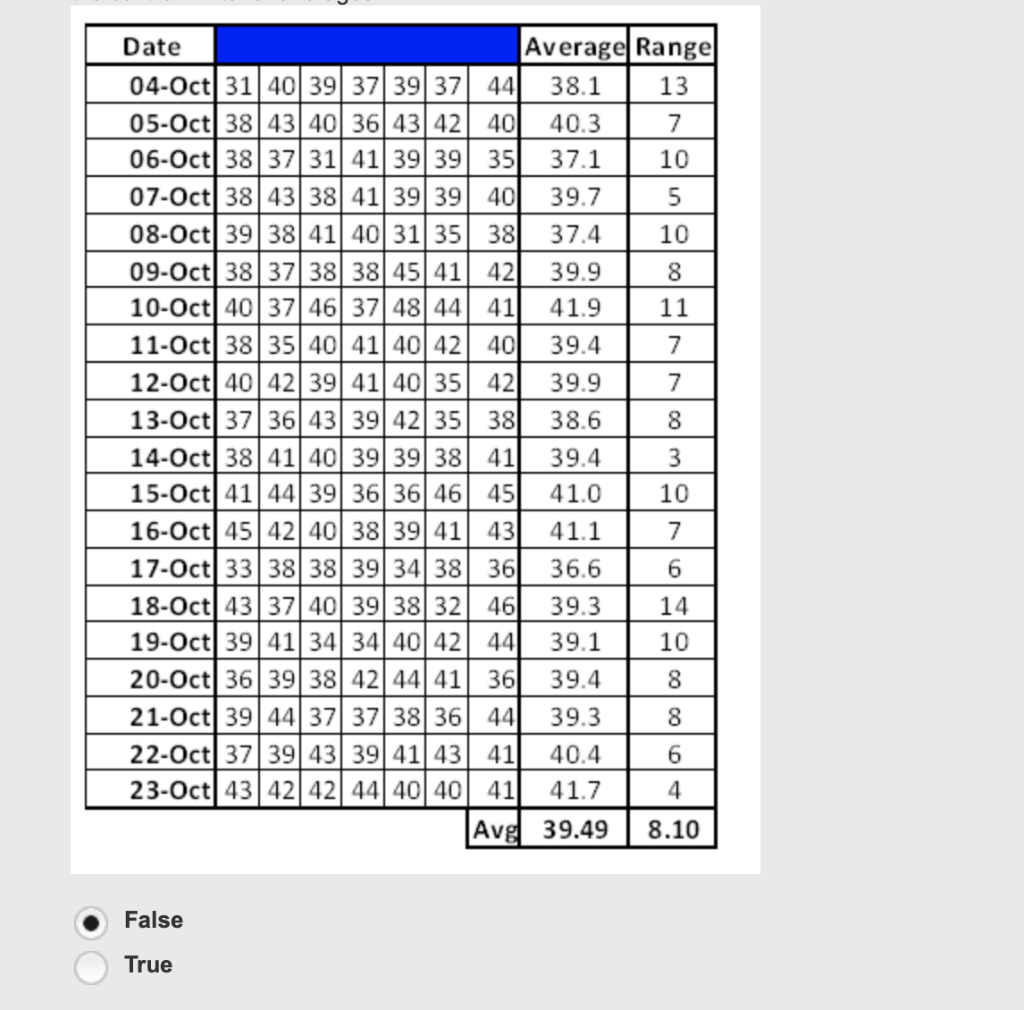
Step by Step Solution

There are 3 Steps involved in it

1 Expert Approved Answer
Step: 1 Unlock blur-text-image
Question Has Been Solved by an Expert!

Get step-by-step solutions from verified subject matter experts

Step: 2 Unlock
Step: 3 Unlock

Students Have Also Explored These Related General Management Questions!