

Question: Evaluate the following using the table below. USL = 52, LSL = 29 The control limits for averages are closest to the following: 52.0 and
Evaluate the following using the table below. USL = 52, LSL = 29 The control limits for averages are closest to the following:
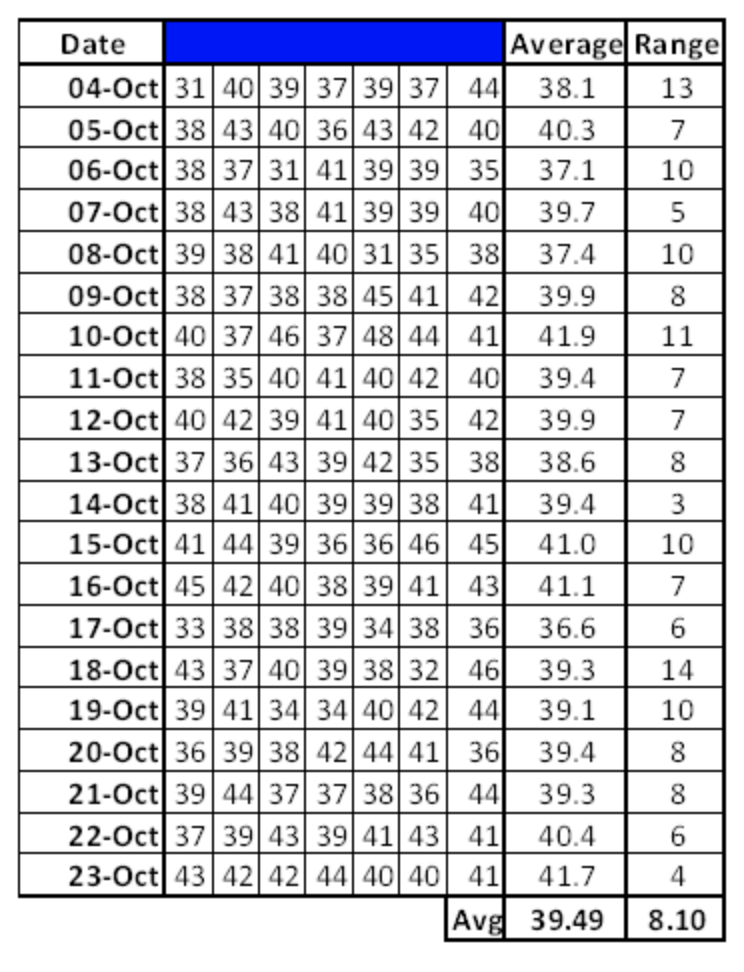
52.0 and 29.0
44.2 and 35.1
42.9 and 36.1
none of the above
Date Average Rangel 04-Oct|31|40|39|37|3937| 44 38.1 13 05-Oct|38|43|40|36|43|42| 40 40.3 7 06-Oct|38|37|31| 4139|39| 35 37.1 10 07-Oct| 38 43 38 41 39 39 40 39.7 5 08-Oct|39|38|4140313538 37.4 10 09-Oct|38|37|38 38|45|41| 42 39.9 8 10-Oct|40|37|46|37|48|44| 41| 41.9 11 11-Oct|38|35|40| 41|40|42| 40 39.4 7 12-Oct|40|42|39|41|40|35| 42 39.9 7 13- 37|36|43|39|42|35| 38) 38.6 8 14-Oct|38|4140 39 39 38 41 39.4 3 15-Oct|41|44|39|36|36|46| 45 41.0 10 16-Oct|45|42|40| 38 39 41 43 41.1 7 17-Oct|33|38| 38 39 34/38 36 36.6 6 18-Oct|43|37|40|39|383246 39.3 14 19-Oct|39|41|34|34|40|42| 44 39.1 10 20-Oct|36|39|38|42|44|4136 39.4 8 21-Oct|39|44| 37 37 38 36 44 39.3 8 22-Oct|37|39|43|39|41|43| 41| 40.4 6 23-Oct|43|42|42|44|40| 40 41 41.7 4 Avg 39.49 8.10Step by Step Solution
There are 3 Steps involved in it
1 Expert Approved Answer
Step: 1 Unlock

Question Has Been Solved by an Expert!
Get step-by-step solutions from verified subject matter experts
Step: 2 Unlock
Step: 3 Unlock