

Question: evaluate the four sorting algorithms on various inputs and relate their theoretical run time to their empirical (actual) behavior. These algorithms are SelectionSort, InsertionSort, MergeSort,
evaluate the four sorting algorithms on various inputs and relate their theoretical run time to their empirical (actual) behavior. These algorithms are SelectionSort, InsertionSort, MergeSort, and QuickSort. In the interests of time, you have been provided with code that implements all four algorithms and can run them on inputs of varying sizes and types.
results should be divided into two parts, Results and Analysis. For the Results section, you will need to prepare a data file describing the performance of your algorithms, and in the Analysis portion, you will need to prepare a table describing their complexity, as well as a response to these results.
.1. Results
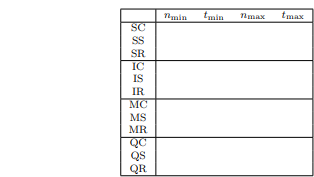
Run each of the four sorting algorithms on constant, sorted, and random arrays that are powers of 10. For each of the twelve cases, you should record the following: 1. nmin: the smallest power of 10 array size that takes 20 milliseconds or more per run to sort; 2. tmin: the time to sort an array of size nmin; 3. nmax: the largest power of 10 array size that takes 10 minutes or less per run to sort (30 mins for all 3 runs), or the largest input size you can successfully sort if no input took more than 30 minutes total; 4. tmax: the time required to sort nmax elements. Note, you may need to ensure that you have sufficient stack space before testing QuickSort to ensure that you do not run out (stack overflow). You can run ulimit -s unlimited in Linux before executing the algorithm to increase the available stack space. This parameter can also be changed in many IDEs on Mac and Windows; consult the appropriate documentation if this becomes a problem. If you are having trouble running the program on an array of 1 billion elements (or running large arrays with QuickSort), I recommend using a somewhat smaller array, like 500 or 250 million. The goal of this project is to find a nmin and nmax that are sufficiently far apart that the growth rate of the time complexity can be approximated using the timing and input size ratios. The descriptions of nmin and nmax given above are just to give you a reasonable idea of how to find good array sizes; finding the exact value of nmin that takes 20 milliseconds to run, for instance, is not critical. If you are having trouble getting good timing results (e.g., one powerof-ten gives good timing results, but the next is too long and the previous too quick), you may try using intermediate input sizes, such as 3.2 10x , 1.8 10x , or 5.6 10x . You may also use different systems to perform the tests for different algorithm/input combinations, but obviously, youll want all of the runs for a single experiment to be on the same machine, as computing a timing ratio with results from different machines is virtually meaningless. You should enter your results into a comma-separated value (CSV) file. The CSV file should contain 5 columns and 13 rows. Your first column should label the 12 different experiments, while the first row labels the experiment variables (nmin, tmin, nmax, and tmax). Your row labels should include the algorithm name (SelectionSort, InsertionSort, MergeSort, or Quicksort) and input type (Sorted, Random, or Constant). You may abbreviate these labels as S, I, M, Q, and S, R, C. (For example, SS represents your SelectionSort result on a sorted array.) An example table appears below. You may use Excel (or any other software) to prepare your data.
.2. Analysis
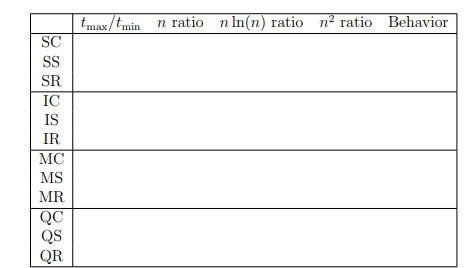
In this section, you will estimate the complexity of the four algorithms by comparing the ratio between tmin and tmax to ratios representing the complexity of the algorithm. Specifically, you should compute f(nmax)/f(nmin) for f1(n) = n, f2(n) = n ln(n), and f3(n) = n 2 . You should round to the nearest integer when computing these ratios. Finally, you should label each experiment according to the ratio tmax/tmin most resembles. For example, if one of your experiments resulting in nmin = 100 and nmax = 10, 000, 000, your ratios would be f1(nmax)/f1(nmin)10, 000, 000/100 = 100, 000, f2(nmax)/f2(nmin) = 10, 000, 000 ln(10, 000, 000)/(100 ln(100)) = 350, 000, and f3(nmax)/f3(nmin) = 10, 000, 0002/1002 = 10, 000, 000, 000. You would then label the algorithm based on which of these three ratios tmax/tmin is closest to. As part of your report, you should create a chart that includes the computed ratios as well as the behavior of the algorithm (Linear, n lg n, or Quadratic), across all 12 experiments. An example chart appears below:
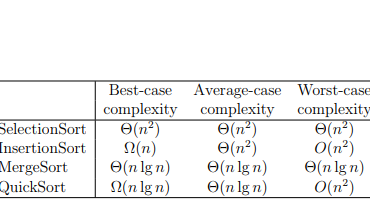
You should then write a summary of (1) how your results compare to the theoretical analysis for the three algorithms (below), and (2) why your results make sense or are surprising. You should spend more time explaining your results when they are unusual or unexpected.
codes:
//Makefile
CC=g++CFLAGS=INC=LIB= all: sorting sorting: Driver.o Helper.o $(CC) $(CFLAGS) -o $@ $^ $(LIB).cpp.o: $(CC) $(CFLAGS) $(INC) -c -o $@ $^ Driver.cpp: Sorting.hpp Helper.cpp Helper.cpp: Helper.hpp clean:rm -f *.o sorting sorting.hpp
//Sorting.hpp
#ifndef __SORTING_HPP #define __SORTING_HPP #include //Helper.hpp #ifndef __SORTING_HELPER_H #define __SORTING_HELPER_H #include //Helper.cpp #include "Helper.hpp" #include //Driver.cpp #include
Step by Step Solution
There are 3 Steps involved in it

Get step-by-step solutions from verified subject matter experts