Question: Ex. 1 Parsing sensor logs for analysis (20 Points) The output produced by specialized software applications often contain a mixture of diagnostic details as well
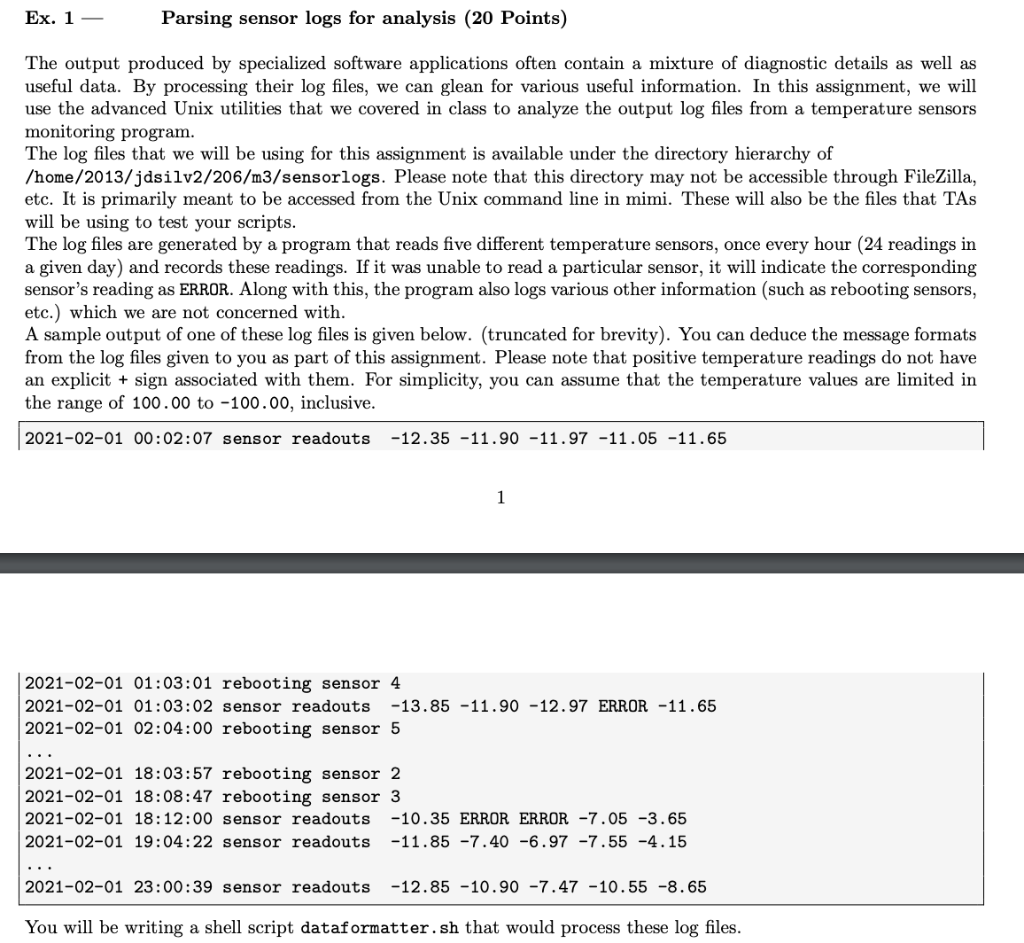
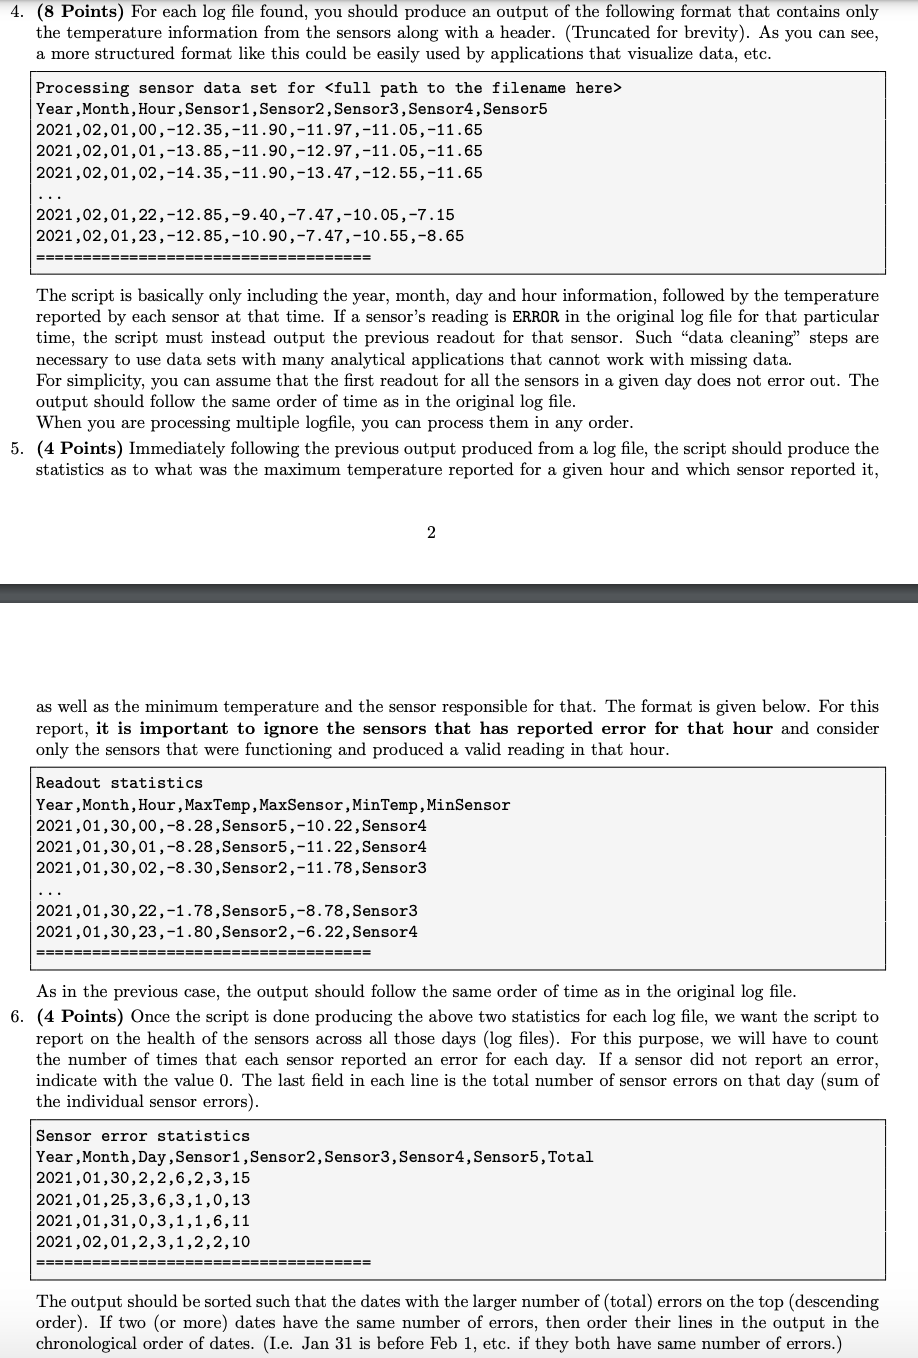
Ex. 1 Parsing sensor logs for analysis (20 Points) The output produced by specialized software applications often contain a mixture of diagnostic details as well as useful data. By processing their log files, we can glean for various useful information. In this assignment, we will use the advanced Unix utilities that we covered in class to analyze the output log files from a temperature sensors monitoring program. The log files that we will be using for this assignment is available under the directory hierarchy of /home/2013/jdsilv2/206/m3/sensorlogs. Please note that this directory may not be accessible through FileZilla, etc. It is primarily meant to be accessed from the Unix command line in mimi. These will also be the files that TAS will be using to test your scripts. The log files are generated by a program that reads five different temperature sensors, once every hour (24 readings in a given day) and records these readings. If it was unable to read a particular sensor, it will indicate the corresponding sensor's reading as ERROR. Along with this, the program also logs various other information (such as rebooting sensors, etc.) which we are not concerned with. A sample output of one of these log files is given below. (truncated for brevity). You can deduce the message formats from the log files given to you as part of this assignment. Please note that positive temperature readings do not have an explicit + sign associated with them. For simplicity, you can assume that the temperature values are limited in the range of 100.00 to -100.00, inclusive. 2021-02-01 00:02:07 sensor readouts -12.35 -11.90 -11.97 -11.05 -11.65 1 2021-02-01 01:03:01 rebooting sensor 4 2021-02-01 01:03:02 sensor readouts -13.85 -11.90 -12.97 ERROR -11.65 2021-02-01 02:04:00 rebooting sensor 5 2021-02-01 18:03:57 rebooting sensor 2 2021-02-01 18:08:47 rebooting sensor 3 2021-02-01 18:12:00 sensor readouts -10.35 ERROR ERROR -7.05 -3.65 2021-02-01 19:04:22 sensor readouts -11.85 -7.40 -6.97 -7.55 -4.15 2021-02-01 23:00:39 sensor readouts -12.85 -10.90 -7.47 -10.55 -8.65 You will be writing a shell script dataformatter.sh that would process these log files. 4. (8 Points) For each log file found, you should produce an output of the following format that contains only the temperature information from the sensors along with a header. (Truncated for brevity). As you can see, a more structured format like this could be easily used by applications that visualize data, etc. Processing sensor data set for Year , Month,Hour, Sensor1, Sensor2, Sensor3, Sensor4, Sensor5 2021,02,01,00,-12.35,-11.90,-11.97,-11.05,-11.65 2021,02,01,01,-13.85, -11.90,-12.97,-11.05,-11.65 2021,02,01,02,-14.35,-11.90,-13.47,-12.55,-11.65 2021,02,01,22,-12.85,-9.40,-7.47,-10.05,-7.15 2021,02,01, 23,-12.85,-10.90,-7.47,-10.55,-8.65 ================= ================== The script is basically only including the year, month, day and hour information, followed by the temperature reported by each sensor at that time. If a sensor's reading is ERROR in the original log file for that particular time, the script must instead output the previous readout for that sensor. Such "data cleaning" steps are necessary to use data sets with many analytical applications that cannot work with missing data. For simplicity, you can assume that the first readout for all the sensors in a given day does not error out. The output should follow the same order of time as in the original log file. When you are processing multiple logfile, you can process them in any order. 5. (4 Points) Immediately following the previous output produced from a log file, the script should produce the statistics as to what was the maximum temperature reported for a given hour and which sensor reported it, 2 as well as the minimum temperature and the sensor responsible for that. The format is given below. For this report, it is important to ignore the sensors that has reported error for that hour and consider only the sensors that were functioning and produced a valid reading in that hour. Readout statistics Year, Month,Hour, MaxTemp, MaxSensor, MinTemp, MinSensor 2021,01,30,00,-8.28, Sensor5,-10.22, Sensor4 2021,01,30,01,-8.28, Sensor5, -11.22, Sensor4 2021,01,30,02,-8.30, Sensor2,-11.78, Sensor3 2021,01,30, 22,-1.78, Sensor5,-8.78, Sensor3 2021,01,30,23,-1.80, Sensor2,-6.22, Sensor4 ============ ========== As in the previous case, the output should follow the same order of time as in the original log file. 6. (4 Points) Once the script is done producing the above two statistics for each log file, we want the script to report on the health of the sensors across all those days (log files). For this purpose, we will have to count the number of times that each sensor reported an error for each day. If a sensor did not report an error, indicate with the value 0. The last field in each line is the total number of sensor errors on that day (sum of the individual sensor errors). Sensor error statistics Year, Month, Day, Sensor1, Sensor2, Sensor3, Sensor4, Sensor5, Total 2021,01,30,2,2,6,2,3,15 2021,01,25,3,6,3,1,0,13 2021,01,31,0,3,1,1,6,11 2021,02,01,2,3,1,2,2,10 =============== The output should be sorted such that the dates with the larger number of (total) errors on the top (descending order). If two or more) dates have the same number of errors, then order their lines in the output in the chronological order of dates. (I.e. Jan 31 is before Feb 1, etc. if they both have same number of errors.) Ex. 1 Parsing sensor logs for analysis (20 Points) The output produced by specialized software applications often contain a mixture of diagnostic details as well as useful data. By processing their log files, we can glean for various useful information. In this assignment, we will use the advanced Unix utilities that we covered in class to analyze the output log files from a temperature sensors monitoring program. The log files that we will be using for this assignment is available under the directory hierarchy of /home/2013/jdsilv2/206/m3/sensorlogs. Please note that this directory may not be accessible through FileZilla, etc. It is primarily meant to be accessed from the Unix command line in mimi. These will also be the files that TAS will be using to test your scripts. The log files are generated by a program that reads five different temperature sensors, once every hour (24 readings in a given day) and records these readings. If it was unable to read a particular sensor, it will indicate the corresponding sensor's reading as ERROR. Along with this, the program also logs various other information (such as rebooting sensors, etc.) which we are not concerned with. A sample output of one of these log files is given below. (truncated for brevity). You can deduce the message formats from the log files given to you as part of this assignment. Please note that positive temperature readings do not have an explicit + sign associated with them. For simplicity, you can assume that the temperature values are limited in the range of 100.00 to -100.00, inclusive. 2021-02-01 00:02:07 sensor readouts -12.35 -11.90 -11.97 -11.05 -11.65 1 2021-02-01 01:03:01 rebooting sensor 4 2021-02-01 01:03:02 sensor readouts -13.85 -11.90 -12.97 ERROR -11.65 2021-02-01 02:04:00 rebooting sensor 5 2021-02-01 18:03:57 rebooting sensor 2 2021-02-01 18:08:47 rebooting sensor 3 2021-02-01 18:12:00 sensor readouts -10.35 ERROR ERROR -7.05 -3.65 2021-02-01 19:04:22 sensor readouts -11.85 -7.40 -6.97 -7.55 -4.15 2021-02-01 23:00:39 sensor readouts -12.85 -10.90 -7.47 -10.55 -8.65 You will be writing a shell script dataformatter.sh that would process these log files. 4. (8 Points) For each log file found, you should produce an output of the following format that contains only the temperature information from the sensors along with a header. (Truncated for brevity). As you can see, a more structured format like this could be easily used by applications that visualize data, etc. Processing sensor data set for Year , Month,Hour, Sensor1, Sensor2, Sensor3, Sensor4, Sensor5 2021,02,01,00,-12.35,-11.90,-11.97,-11.05,-11.65 2021,02,01,01,-13.85, -11.90,-12.97,-11.05,-11.65 2021,02,01,02,-14.35,-11.90,-13.47,-12.55,-11.65 2021,02,01,22,-12.85,-9.40,-7.47,-10.05,-7.15 2021,02,01, 23,-12.85,-10.90,-7.47,-10.55,-8.65 ================= ================== The script is basically only including the year, month, day and hour information, followed by the temperature reported by each sensor at that time. If a sensor's reading is ERROR in the original log file for that particular time, the script must instead output the previous readout for that sensor. Such "data cleaning" steps are necessary to use data sets with many analytical applications that cannot work with missing data. For simplicity, you can assume that the first readout for all the sensors in a given day does not error out. The output should follow the same order of time as in the original log file. When you are processing multiple logfile, you can process them in any order. 5. (4 Points) Immediately following the previous output produced from a log file, the script should produce the statistics as to what was the maximum temperature reported for a given hour and which sensor reported it, 2 as well as the minimum temperature and the sensor responsible for that. The format is given below. For this report, it is important to ignore the sensors that has reported error for that hour and consider only the sensors that were functioning and produced a valid reading in that hour. Readout statistics Year, Month,Hour, MaxTemp, MaxSensor, MinTemp, MinSensor 2021,01,30,00,-8.28, Sensor5,-10.22, Sensor4 2021,01,30,01,-8.28, Sensor5, -11.22, Sensor4 2021,01,30,02,-8.30, Sensor2,-11.78, Sensor3 2021,01,30, 22,-1.78, Sensor5,-8.78, Sensor3 2021,01,30,23,-1.80, Sensor2,-6.22, Sensor4 ============ ========== As in the previous case, the output should follow the same order of time as in the original log file. 6. (4 Points) Once the script is done producing the above two statistics for each log file, we want the script to report on the health of the sensors across all those days (log files). For this purpose, we will have to count the number of times that each sensor reported an error for each day. If a sensor did not report an error, indicate with the value 0. The last field in each line is the total number of sensor errors on that day (sum of the individual sensor errors). Sensor error statistics Year, Month, Day, Sensor1, Sensor2, Sensor3, Sensor4, Sensor5, Total 2021,01,30,2,2,6,2,3,15 2021,01,25,3,6,3,1,0,13 2021,01,31,0,3,1,1,6,11 2021,02,01,2,3,1,2,2,10 =============== The output should be sorted such that the dates with the larger number of (total) errors on the top (descending order). If two or more) dates have the same number of errors, then order their lines in the output in the chronological order of dates. (I.e. Jan 31 is before Feb 1, etc. if they both have same number of errors.)


