

Question: Ex. 1 Parsing sensor logs for analysis (20 Points) The output produced by specialized software applications often contain a mixture of diagnostic details as well
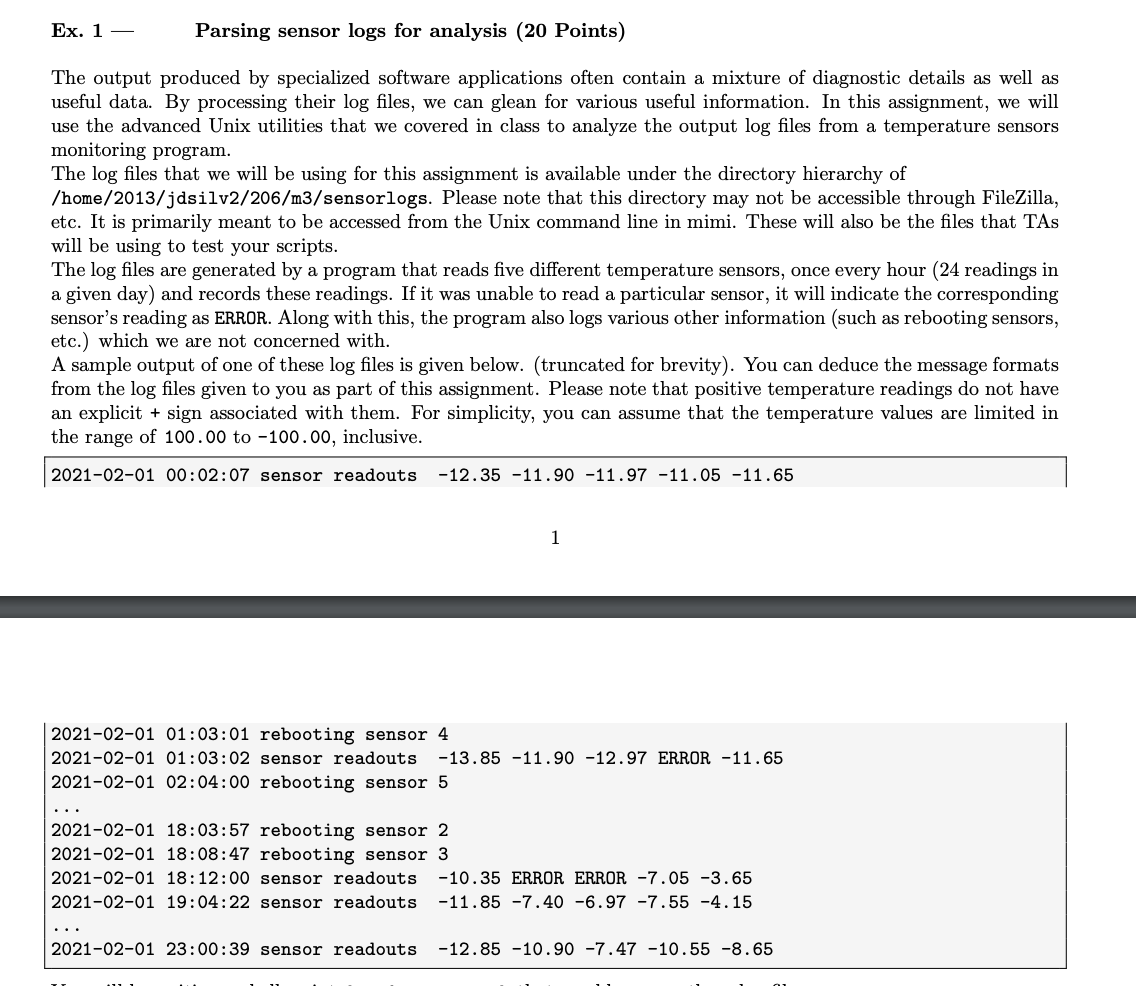
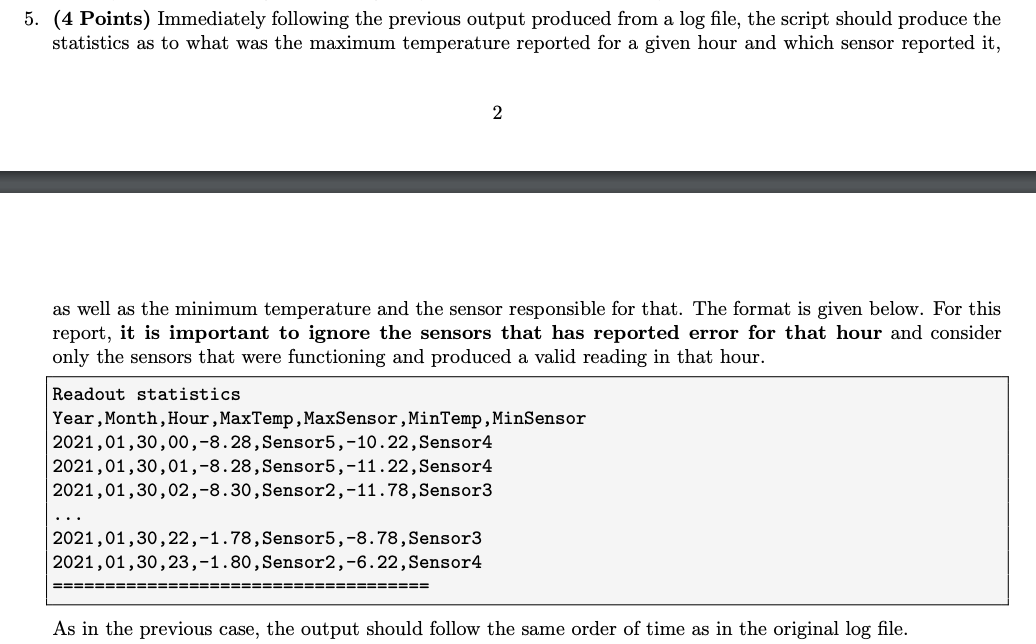
Ex. 1 Parsing sensor logs for analysis (20 Points) The output produced by specialized software applications often contain a mixture of diagnostic details as well as useful data. By processing their log files, we can glean for various useful information. In this assignment, we will use the advanced Unix utilities that we covered in class to analyze the output log files from a temperature sensors monitoring program. The log files that we will be using for this assignment is available under the directory hierarchy of /home/2013/jdsilv2/206/m3/sensorlogs. Please note that this directory may not be accessible through FileZilla, etc. It is primarily meant to be accessed from the Unix command line in mimi. These will also be the files that TAS will be using to test your scripts. The log files are generated by a program that reads five different temperature sensors, once every hour (24 readings in a given day) and records these readings. If it was unable to read a particular sensor, it will indicate the corresponding sensor's reading as ERROR. Along with this, the program also logs various other information (such as rebooting sensors, etc.) which we are not concerned with. A sample output of one of these log files is given below. (truncated for brevity). You can deduce the message formats from the log files given to you as part of this assignment. Please note that positive temperature readings do not have an explicit + sign associated with them. For simplicity, you can assume that the temperature values are limited in the range of 100.00 to -100.00, inclusive. 2021-02-01 00:02:07 sensor readouts -12.35 -11.90 -11.97 -11.05 -11.65 1 2021-02-01 01:03:01 rebooting sensor 4 2021-02-01 01:03:02 sensor readouts -13.85 -11.90 -12.97 ERROR -11.65 2021-02-01 02:04:00 rebooting sensor 5 2021-02-01 18:03:57 rebooting sensor 2 2021-02-01 18:08:47 rebooting sensor 3 2021-02-01 18:12:00 sensor readouts -10.35 ERROR ERROR -7.05 -3.65 2021-02-01 19:04:22 sensor readouts -11.85 -7.40 -6.97 -7.55 -4.15 2021-02-01 23:00:39 sensor readouts -12.85 -10.90 -7.47 -10.55 -8.65 5. (4 Points) Immediately following the previous output produced from a log file, the script should produce the statistics as to what was the maximum temperature reported for a given hour and which sensor reported it, 2 as well as the minimum temperature and the sensor responsible for that. The format is given below. For this report, it is important to ignore the sensors that has reported error for that hour and consider only the sensors that were functioning and produced a valid reading in that hour. Readout statistics Year, Month, Hour , MaxTemp, MaxSensor, MinTemp, MinSensor 2021,01,30,00,-8.28, Sensor5,-10.22, Sensor4 2021,01,30,01,-8.28, Sensor5,-11.22, Sensor4 2021,01,30,02,-8.30, Sensor2,-11.78, Sensor3 2021,01,30,22,-1.78, Sensor5,-8.78, Sensor3 2021,01,30,23,-1.80, Sensor2,-6.22, Sensor4 EEEE ======== As in the previous case, the output should follow the same order of time as in the original log file. Ex. 1 Parsing sensor logs for analysis (20 Points) The output produced by specialized software applications often contain a mixture of diagnostic details as well as useful data. By processing their log files, we can glean for various useful information. In this assignment, we will use the advanced Unix utilities that we covered in class to analyze the output log files from a temperature sensors monitoring program. The log files that we will be using for this assignment is available under the directory hierarchy of /home/2013/jdsilv2/206/m3/sensorlogs. Please note that this directory may not be accessible through FileZilla, etc. It is primarily meant to be accessed from the Unix command line in mimi. These will also be the files that TAS will be using to test your scripts. The log files are generated by a program that reads five different temperature sensors, once every hour (24 readings in a given day) and records these readings. If it was unable to read a particular sensor, it will indicate the corresponding sensor's reading as ERROR. Along with this, the program also logs various other information (such as rebooting sensors, etc.) which we are not concerned with. A sample output of one of these log files is given below. (truncated for brevity). You can deduce the message formats from the log files given to you as part of this assignment. Please note that positive temperature readings do not have an explicit + sign associated with them. For simplicity, you can assume that the temperature values are limited in the range of 100.00 to -100.00, inclusive. 2021-02-01 00:02:07 sensor readouts -12.35 -11.90 -11.97 -11.05 -11.65 1 2021-02-01 01:03:01 rebooting sensor 4 2021-02-01 01:03:02 sensor readouts -13.85 -11.90 -12.97 ERROR -11.65 2021-02-01 02:04:00 rebooting sensor 5 2021-02-01 18:03:57 rebooting sensor 2 2021-02-01 18:08:47 rebooting sensor 3 2021-02-01 18:12:00 sensor readouts -10.35 ERROR ERROR -7.05 -3.65 2021-02-01 19:04:22 sensor readouts -11.85 -7.40 -6.97 -7.55 -4.15 2021-02-01 23:00:39 sensor readouts -12.85 -10.90 -7.47 -10.55 -8.65 5. (4 Points) Immediately following the previous output produced from a log file, the script should produce the statistics as to what was the maximum temperature reported for a given hour and which sensor reported it, 2 as well as the minimum temperature and the sensor responsible for that. The format is given below. For this report, it is important to ignore the sensors that has reported error for that hour and consider only the sensors that were functioning and produced a valid reading in that hour. Readout statistics Year, Month, Hour , MaxTemp, MaxSensor, MinTemp, MinSensor 2021,01,30,00,-8.28, Sensor5,-10.22, Sensor4 2021,01,30,01,-8.28, Sensor5,-11.22, Sensor4 2021,01,30,02,-8.30, Sensor2,-11.78, Sensor3 2021,01,30,22,-1.78, Sensor5,-8.78, Sensor3 2021,01,30,23,-1.80, Sensor2,-6.22, Sensor4 EEEE ======== As in the previous case, the output should follow the same order of time as in the original log file
Step by Step Solution
There are 3 Steps involved in it

Get step-by-step solutions from verified subject matter experts