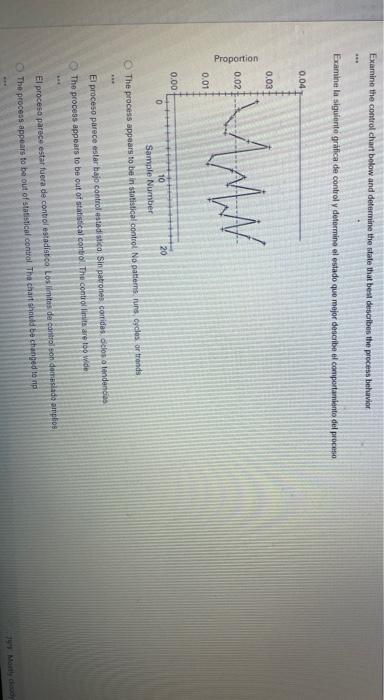
Question: Examine the control chart below and determine the state that be describes the process behavior Examine la siguiente grfica de control y determina el estado

Examine the control chart below and determine the
Examine the control chart below and determine the state that be describes the process behavior Examine la siguiente grfica de control y determina el estado que mejor describe el comportamiento del proceso 0.04 0.03 Proportion 0.02 LAMN 0.01 0.00 0 20 10 Sample Number The process appears to be in statistical control. No patieme runs, cydes of trendi El proceso parece estar bajo control estadistica Sin patrones corridas oclos a londencias The process appears to be out of statistical control The controllimits are too wide El proceso parece estar fuera de control estadistco Los limites de control son demasiado amplos The process appears to be out of statistical control the chart should be changed to ne El proceso parece estar fuera de control estadistico. Los limites de control son demasiado amplios The process appears to be out of statistical control the chart should be changed top El proceso parece estar fuera de control estadistico El grafico debe cambiarse a np. The process appears to be in statistical control but limits need to be adjusted

Step by Step Solution

There are 3 Steps involved in it

1 Expert Approved Answer
Step: 1 Unlock blur-text-image
Question Has Been Solved by an Expert!

Get step-by-step solutions from verified subject matter experts

Step: 2 Unlock
Step: 3 Unlock

Students Have Also Explored These Related General Management Questions!