

Question: Examine the Statistical Process Control outputs below. Answer the following question. table [ [ UCL ( Upper control limit ) , table [
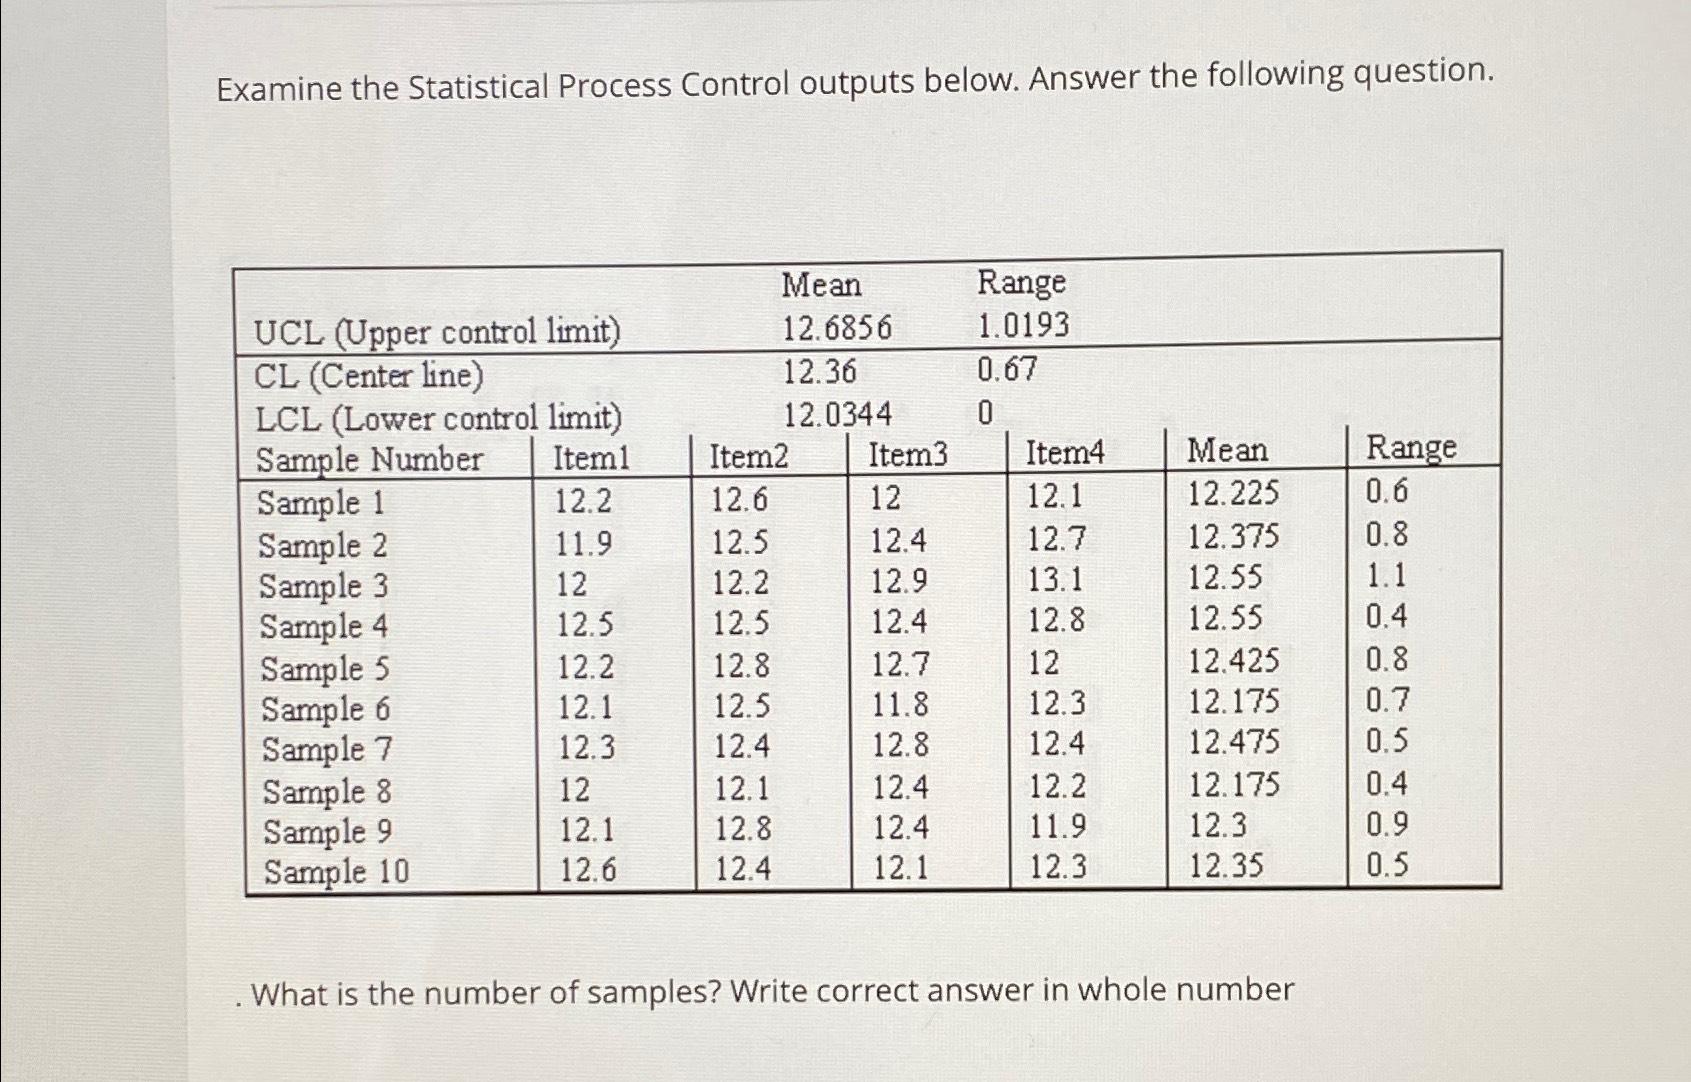
Examine the Statistical Process Control outputs below. Answer the following question.
tableUCL Upper control limittableMeantableRangeCL Center lineLCL Lower control limitRangeSample Number,ItemItemItemItemMeanSample Sample Sample Sample Sample Sample Sample Sample Sample Sample
What is the number of samples? Write correct answer in whole number
Step by Step Solution
There are 3 Steps involved in it
1 Expert Approved Answer
Step: 1 Unlock

Question Has Been Solved by an Expert!
Get step-by-step solutions from verified subject matter experts
Step: 2 Unlock
Step: 3 Unlock