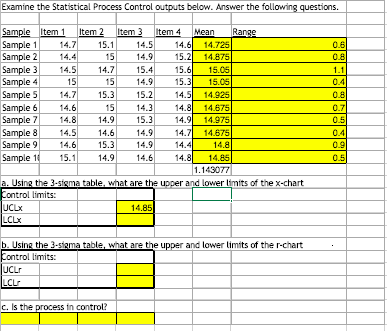
Question: Examine the Statistical Process Control outputs below. Answer the following questions. Sample Item 1 Item 2 Item 3 Item 4 Mean Range Sample 1 14.7

Examine the Statistical Process Control outputs

Examine the Statistical Process Control outputs below. Answer the following questions. Sample Item 1 Item 2 Item 3 Item 4 Mean Range Sample 1 14.7 15.1 14.5 14.6 14.725 Sample 2 15 14.9 15.21 14.875 Sample 3 14.5 14.7 15.4 15.6 15.05 Sample 4 15 15 14.9 15.31 15.05 Sample 5 14.7 15.3 15.2 14.51 14.925 Sample 6 14.6 15 14.3 14.81 14.675 Sample 7 14.8 14.9 15.3 14.9 14.975 Sample 8 14.5 14.6 14.9 14.7 14.675 Sample 9 14.6 15.3 14.9 14.4 14.8 Sample 10 15.1 14.9 14.6 14.81 14.85 1.143077 a. Using the 3-sisma table, what are the upper and lower limits of the x-chart Control limits: UCLX 14.85 LCLX 0.6 0.8 1.1 0.4 0.8 0.71 0.5 0.4 0.9 0.5 b. Using the 3-sigma table, what are the upper and lower limits of the r-chart Kontrollimits: UCLT LCL c. Is the process in control

Step by Step Solution

There are 3 Steps involved in it

1 Expert Approved Answer
Step: 1 Unlock blur-text-image
Question Has Been Solved by an Expert!

Get step-by-step solutions from verified subject matter experts

Step: 2 Unlock
Step: 3 Unlock

Students Have Also Explored These Related General Management Questions!