

Question: Examine the two figures from the article Secular Changes in Children's Ability to Delay Gratification in the Past 50 Years . Answer the following
Examine the two figures from the article Secular Changes in Children's Ability to Delay Gratification in the Past 50 Years.
Answer the following questions about each figure:
- The following questions are regarding Figure 1.
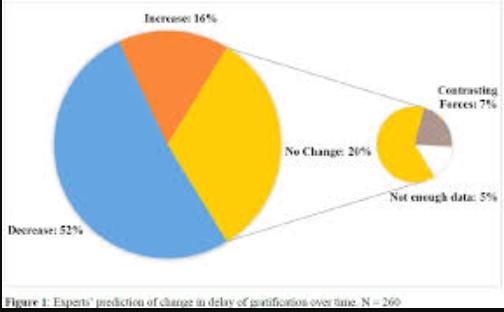 Figure 1: Experts' prediction of change in delay of gratification over time. N = 260
- How many experts participated in this study?
- What did they predict for the results in change of delay of gratification over time?
- What does the larger yellow piece of the pie chart represents?
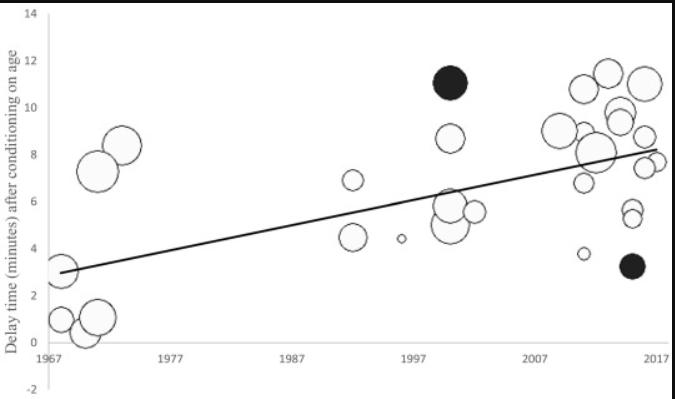
Figure 2: Meta-regression on changes in the ability of children to delay gratification over the past 50 years on the marshmallow test, conditioning on age. Bubbles are weighted by the meta[1]analytic standard errors and represent raw delay times, not age-conditioned times. Black bubbles indicate meta-analytic outliers
2. The following questions are regarding Figure 2.
- What does in the line in this graph represent?
- What does it mean when a bubble is smaller?
- What is your conclusion based on this graph?
Decrease: 52% Increase: 16% No Change: 20% Contrasting Forces: 7% Not enough data: 5% Figure 1: Experts prediction of change in delay of gratification over time. N-260
Step by Step Solution
3.45 Rating (152 Votes )
There are 3 Steps involved in it
Figure 1 1 260 experts participated in this study 2 The experts predicted that the ability of childr... View full answer

Get step-by-step solutions from verified subject matter experts