

Question: Example 1 1 : Total, elevation and pressure head With reference to the figure below, plot the variation of total head, elevation head and (
Example : Total, elevation and pressure head
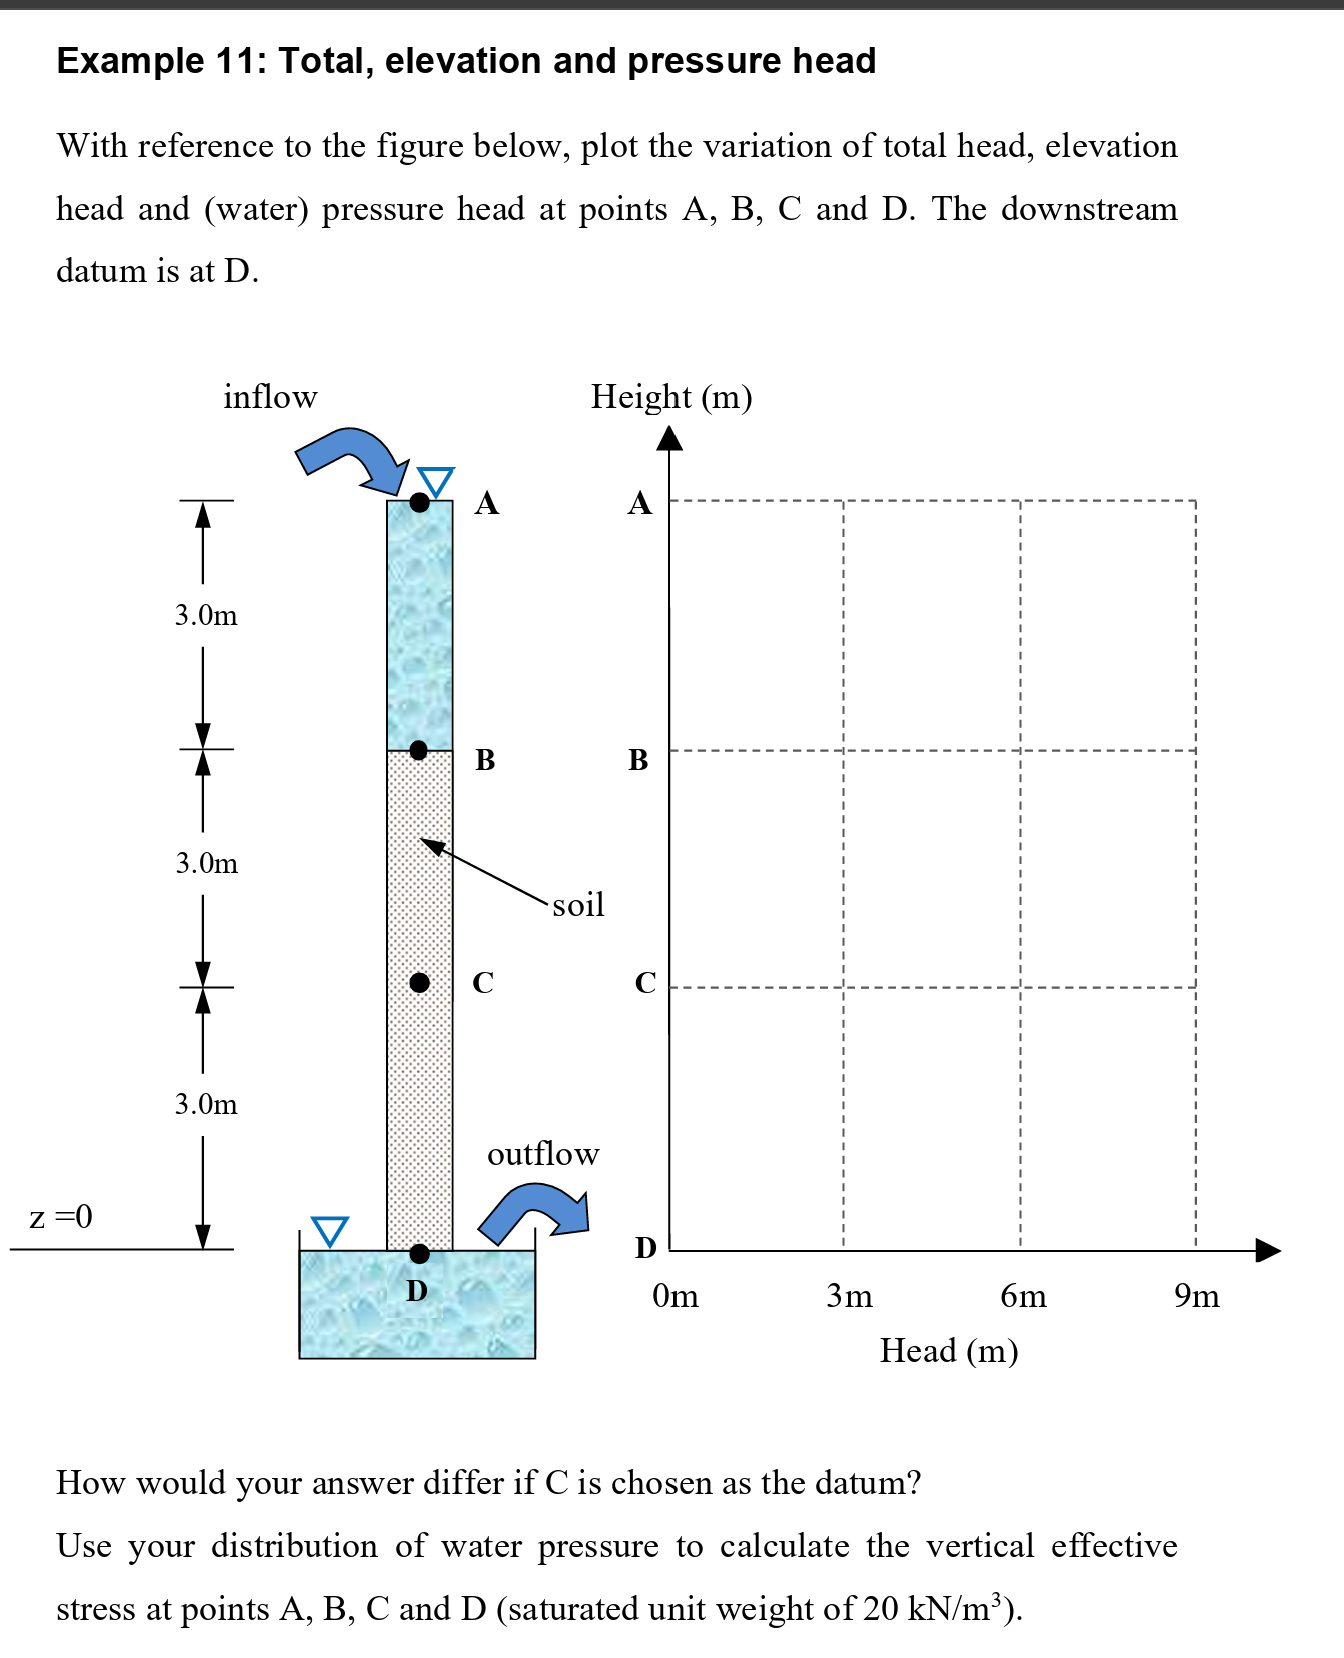
With reference to the figure below, plot the variation of total head, elevation
head and water pressure head at points A B C and D The downstream
datum is at
How would your answer differ if is chosen as the datum?
Use your distribution of water pressure to calculate the vertical effective
stress at points A B C and D saturated unit weight of
Step by Step Solution
There are 3 Steps involved in it
1 Expert Approved Answer
Step: 1 Unlock

Question Has Been Solved by an Expert!
Get step-by-step solutions from verified subject matter experts
Step: 2 Unlock
Step: 3 Unlock