

Question: EXAMPLE 1 Draw the grain size distribution curve. Determine effective size and uniformity coefficient table [ [ US Sieve No , 4 , 1
EXAMPLE
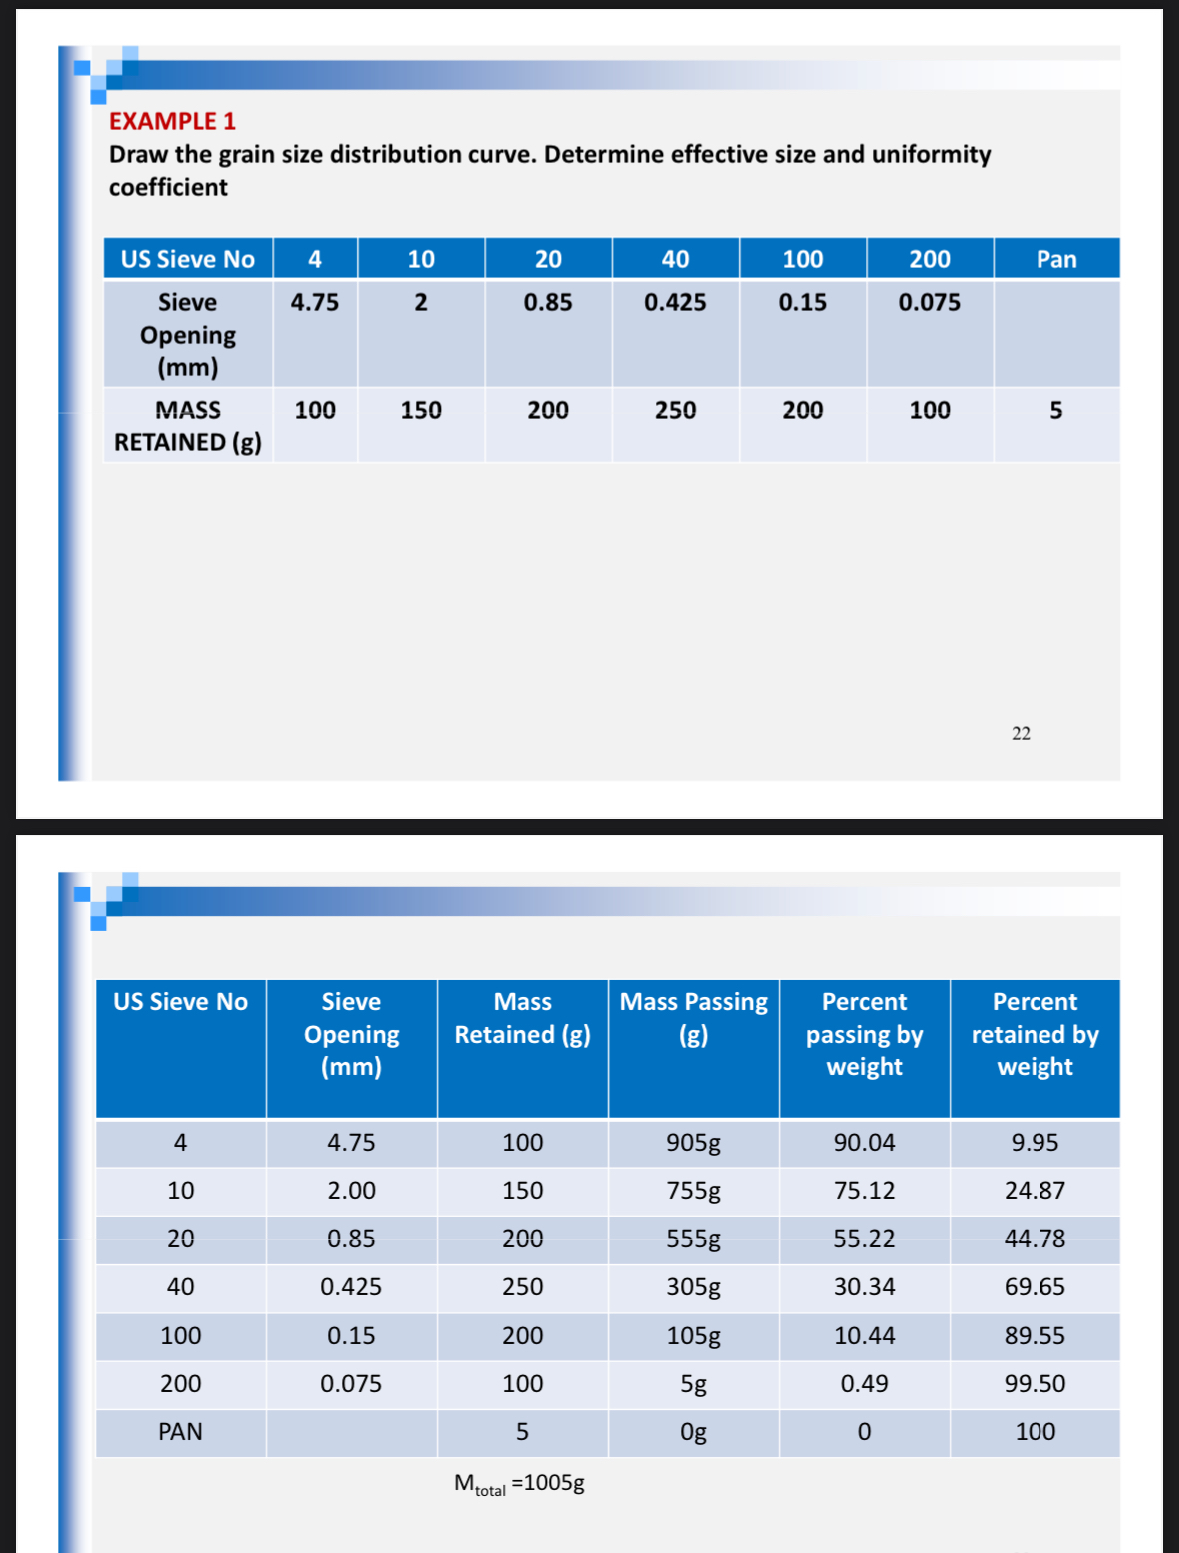
Draw the grain size distribution curve. Determine effective size and uniformity coefficient
tableUS Sieve NoPantableSieveOpening
Step by Step Solution
There are 3 Steps involved in it
1 Expert Approved Answer
Step: 1 Unlock

Question Has Been Solved by an Expert!
Get step-by-step solutions from verified subject matter experts
Step: 2 Unlock
Step: 3 Unlock