

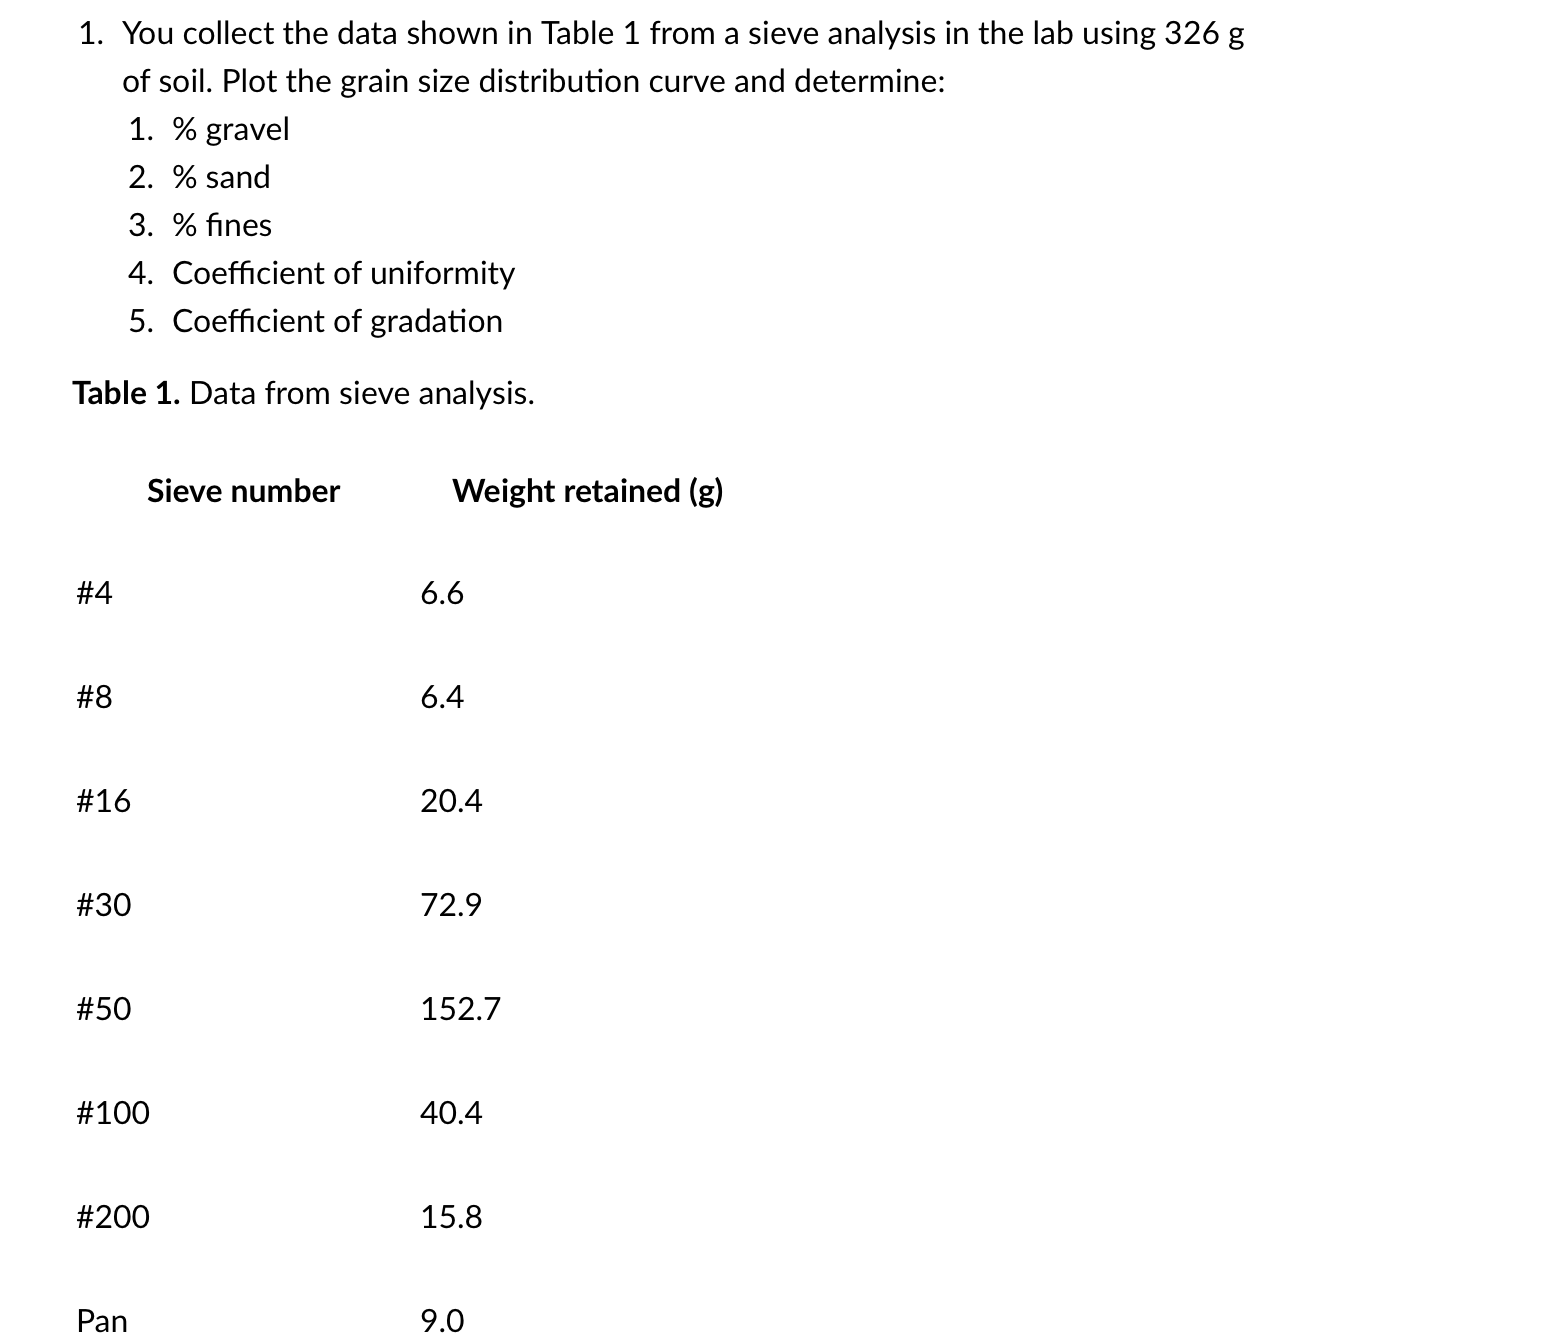
Question: You collect the data shown in Table 1 from a sieve analysis in the lab using 3 2 6 g of soil. Plot the grain
You collect the data shown in Table from a sieve analysis in the lab using
of soil. Plot the grain size distribution curve and determine:
gravel
sand
fines
Coefficient of uniformity
Coefficient of gradation
Table Data from sieve analysis.
Sieve number Weight retained
#
#
#
#
#
#
#
Pan
Step by Step Solution
There are 3 Steps involved in it
1 Expert Approved Answer
Step: 1 Unlock

Question Has Been Solved by an Expert!
Get step-by-step solutions from verified subject matter experts
Step: 2 Unlock
Step: 3 Unlock