

Question: Example E15-18. Can you walk me through a? Prepare a contribution income statement for June. Prepare a cost-volume-profit graph. Label the horizontal axis in units
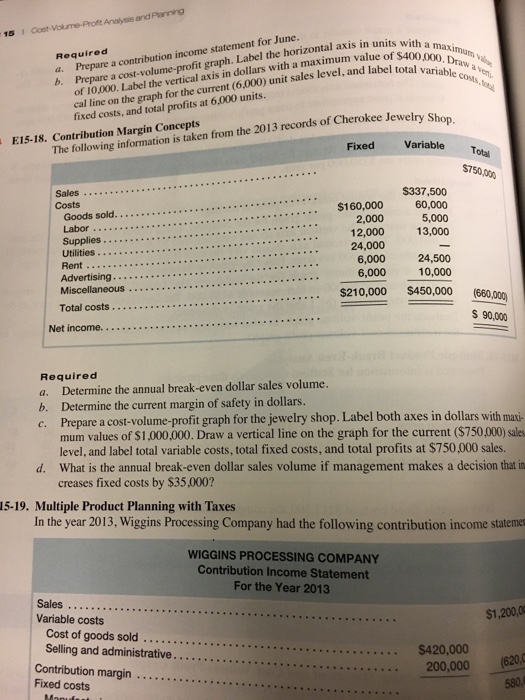
Prepare a contribution income statement for June. Prepare a cost-volume-profit graph. Label the horizontal axis in units with a maximum value of 10,000. Label the vertical axis in dollars with a maximum value of $400,000. Draw a vertical line on the graph for the current (6,000) unit sales level, and label total variable costs, total fixed costs, and total profits at 6,000 units. The following information is taken from the 2013 records of Cherokee Jewelry shop. Determine the annual break-even dollar sales volume. Determine the current margin of safety in dollars. Prepare a cost-volume-profit graph for the jewelry shop. Label both axes in dollars with maximum values of $1 .000.000. Draw a vertical line on the graph for the current ($750,000) sales level, and label total variable costs, total fixed costs, and total profits at $750,000 sales. What is the annual break-even dollar sales volume if management makes a decision that increases fixed costs by $35,000? In the year 2013. Wiggins Processing Company had the following contribution income statement
Step by Step Solution
There are 3 Steps involved in it

Get step-by-step solutions from verified subject matter experts