

Question: Excel Activity: Evaluating Risk and Return Start with the partial model in the file Ch02 P15 Build a Model.xlsx. The file contains data for this
Excel Activity: Evaluating Risk and Return Start with the partial model in the file Ch02 P15 Build a Model.xlsx. The file contains data for this problem. Goodman Corporation's and Landry Incorporated's stock prices and dividends, along with the Market Index, are shown here. Stock prices are reported for December 31 of each year, and dividends reflect those paid during the year. The market data are adjusted to include dividends.
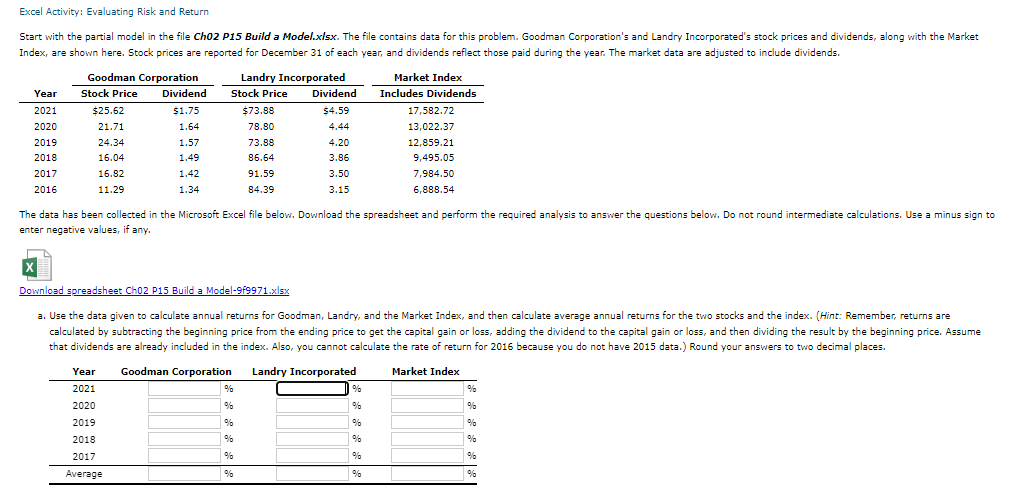
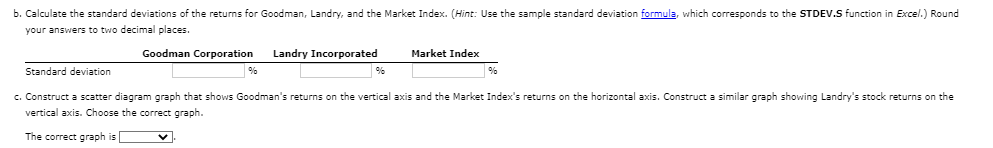
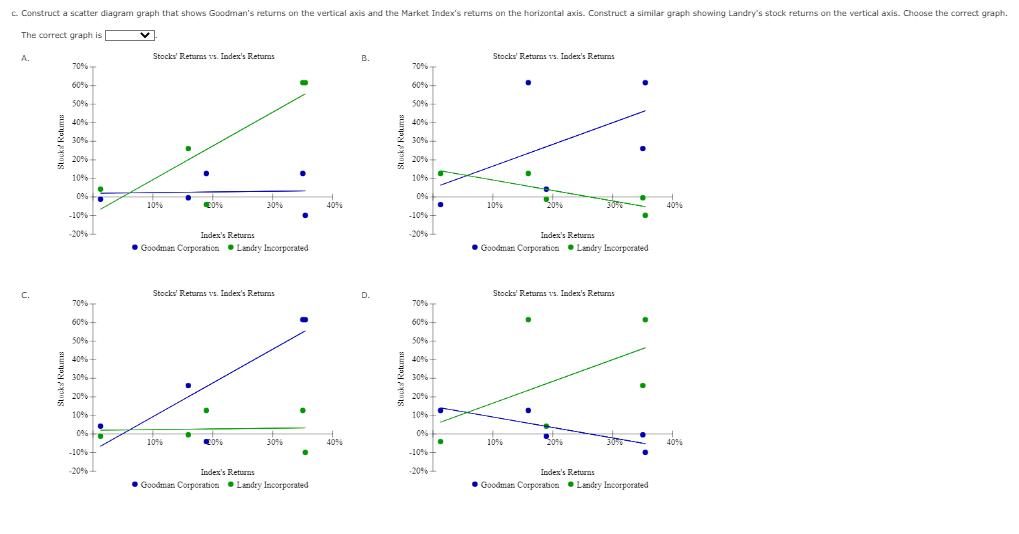
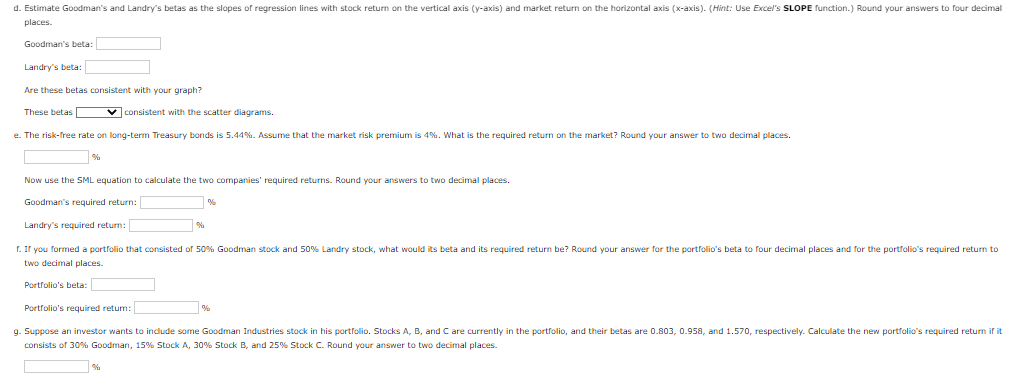
Excel Activity: Evaluating Risk and Return Index, are shown here. Stock prices are reported for December 31 of each year, and dividends reflect those paid during the year. The market data are adjusted to include dividends. enter negative values, if any. Download spreadsheet Ch02 p15 Build a Model-9f9971,xlsx vertical axis. Choose the correct graph. The correct graph is The correct graph is A. B. C. D. Stocks' Returns vs. Index's Returns places. Goodman's beta: Landry's beta: Are these betas consistent with your graph? These betas consistent with the scatter diagrams. Now use the SML equation to calculate the two companies' required returns. Round your answers to two decimal places. Goodman's required return: Landry's required return: two decimal places. Portfolio's beta: Portfolio's required retum: consists of 30% Goodman, 15% Stock A, 30\% Stock B, and 25% Stock C. Round your answer to two decimal places. Excel Activity: Evaluating Risk and Return Index, are shown here. Stock prices are reported for December 31 of each year, and dividends reflect those paid during the year. The market data are adjusted to include dividends. enter negative values, if any. Download spreadsheet Ch02 p15 Build a Model-9f9971,xlsx vertical axis. Choose the correct graph. The correct graph is The correct graph is A. B. C. D. Stocks' Returns vs. Index's Returns places. Goodman's beta: Landry's beta: Are these betas consistent with your graph? These betas consistent with the scatter diagrams. Now use the SML equation to calculate the two companies' required returns. Round your answers to two decimal places. Goodman's required return: Landry's required return: two decimal places. Portfolio's beta: Portfolio's required retum: consists of 30% Goodman, 15% Stock A, 30\% Stock B, and 25% Stock C. Round your answer to two decimal places
Step by Step Solution
There are 3 Steps involved in it

Get step-by-step solutions from verified subject matter experts